Setting the Scene
Population
Population Estimates
and Projections
Mid-2018 Estimates
The latest ONS population estimates (2) are for mid-2018, and show that Blackburn with Darwen had a total of 148,942 residents (an increase of 170 since mid-2017). In Figure 1 below, the England age structure is superimposed for comparison. This illustrates that Blackburn with Darwen has a much younger age profile than average. 28.4% of its population is aged under 20, which is the 6th highest proportion in England.
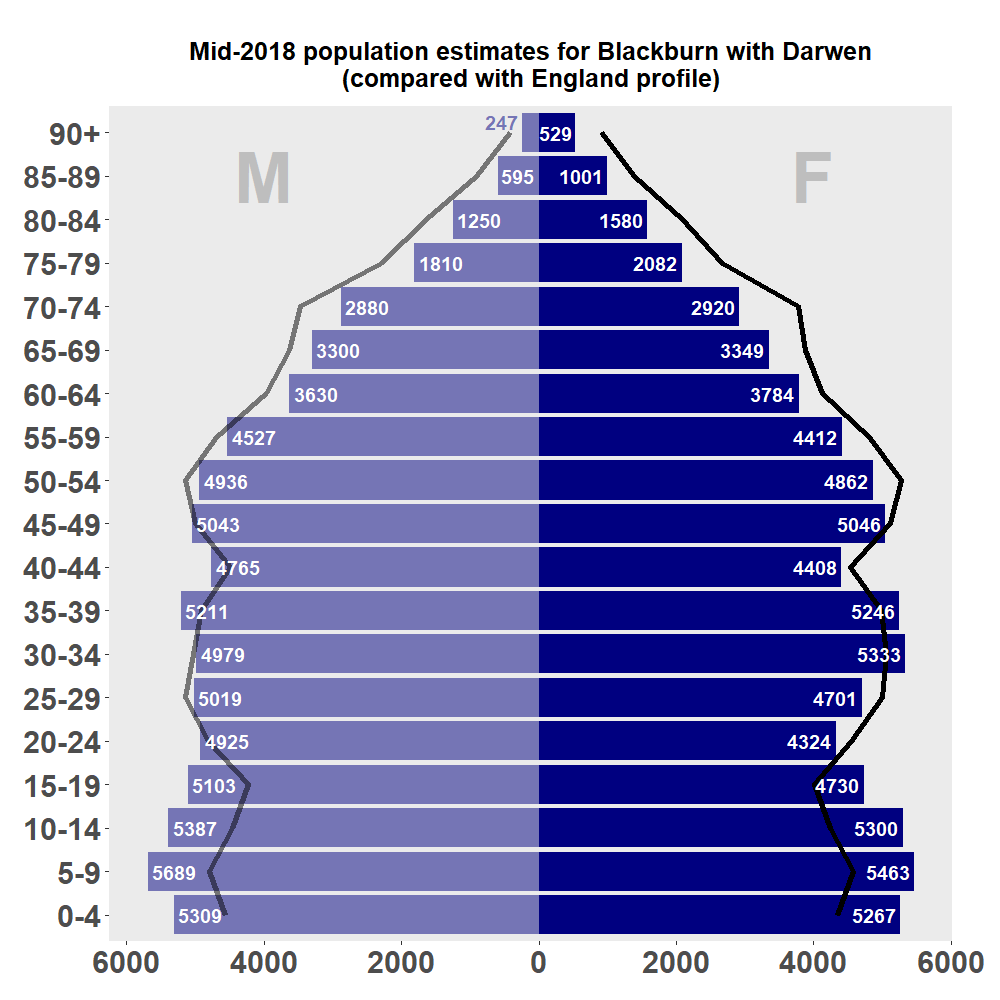
Figure 1: ONS mid-2018 population estimate for Blackburn with Darwen
(with England profile for comparison)
Population Projections
The latest population projections (3) are still based on the population estimates for mid-2016, and look ahead to 2041. For Blackburn with Darwen overall, they predict a slow, almost imperceptible fall in population (Figure 2). However, the 65+ age-group (shown in green) is expected to rise by approximately 8,300 over the period - ie. by almost 40%. The 85+ group in particular is projected to rise by over 80%, from approximately 2400 to 4400.
Figure 2: (interactive) 2016-based ONS population projections, Blackburn with Darwen
2011 Census Data
Ethnicity
The 2011 Census (4) is still our best source of data on the ethnic breakdown of the borough’s population, and the relationship between ethnic group and other social characteristics. The proportion of Blackburn with Darwen residents who described themselves as Indian or Pakistani are the 11th highest and the 6th highest respectively of any local authority in England.
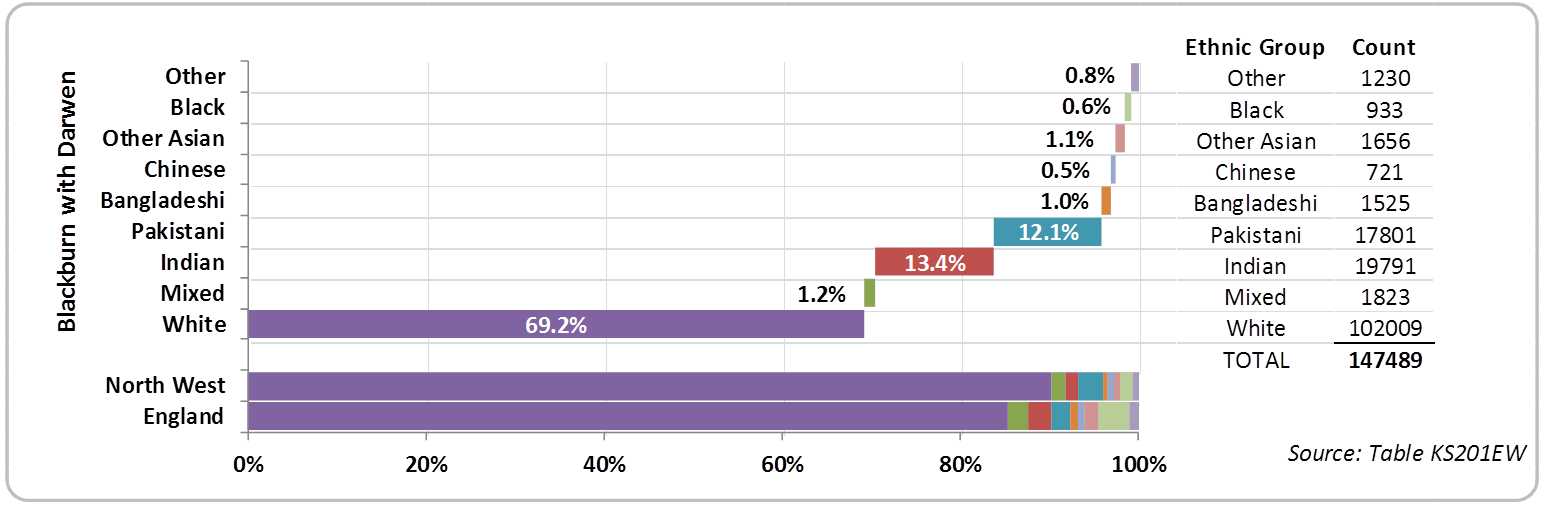
Figure 3: Ethnicity: Blackburn with Darwen v. NW and England, 2011
(showing counts for Blackburn with Darwen)
The main ethnic groups have markedly different age profiles from each other (Figure 4, and are represented in varying concentrations across the borough (Figure 5).
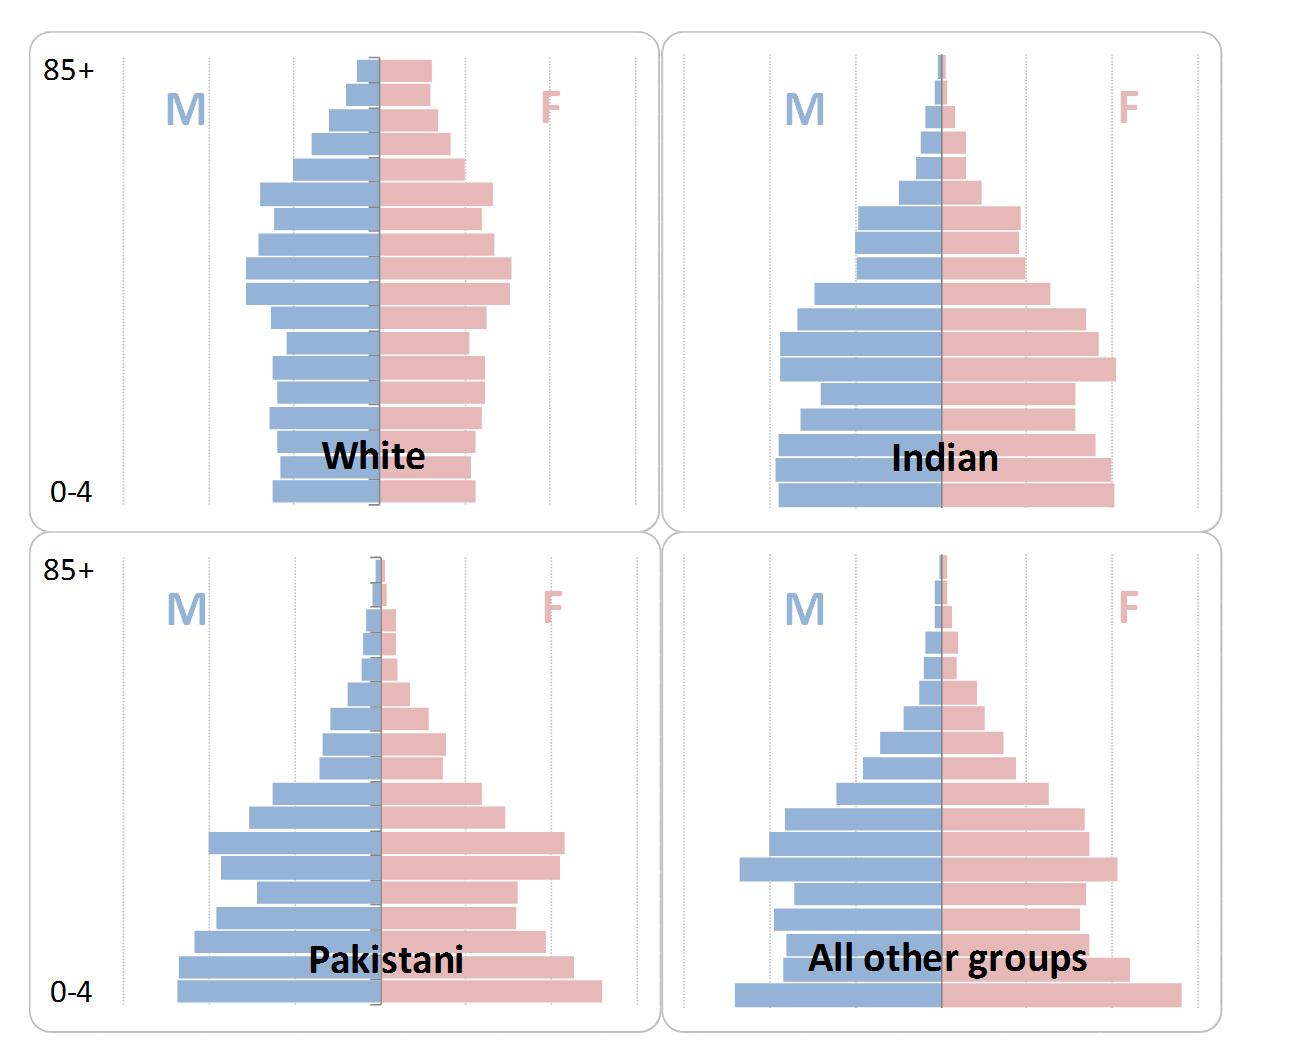
Figure 4: Age profiles by ethnic group,
Blackburn with Darwen, 2011
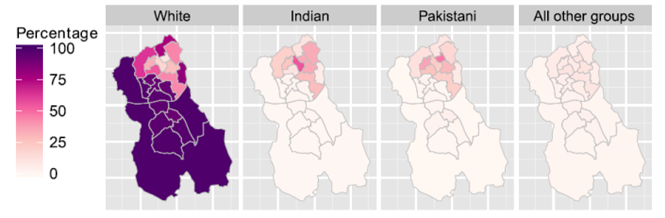
Figure 5: Blackburn with Darwen - ethnicity by ward
Religion
At the 2011 Census, 77,599 Blackburn with Darwen residents (52.6%) identified themselves as Christian, and 39,817 (27.0%) as Muslim. 13.8% had no religion, and 5.6% did not answer the question. Religion and ethnicity are closely interlinked, with the vast majority of Christians in the borough being White, and almost all Muslims being Indian, Pakistani or members of other minority ethnic groups (Figure 6).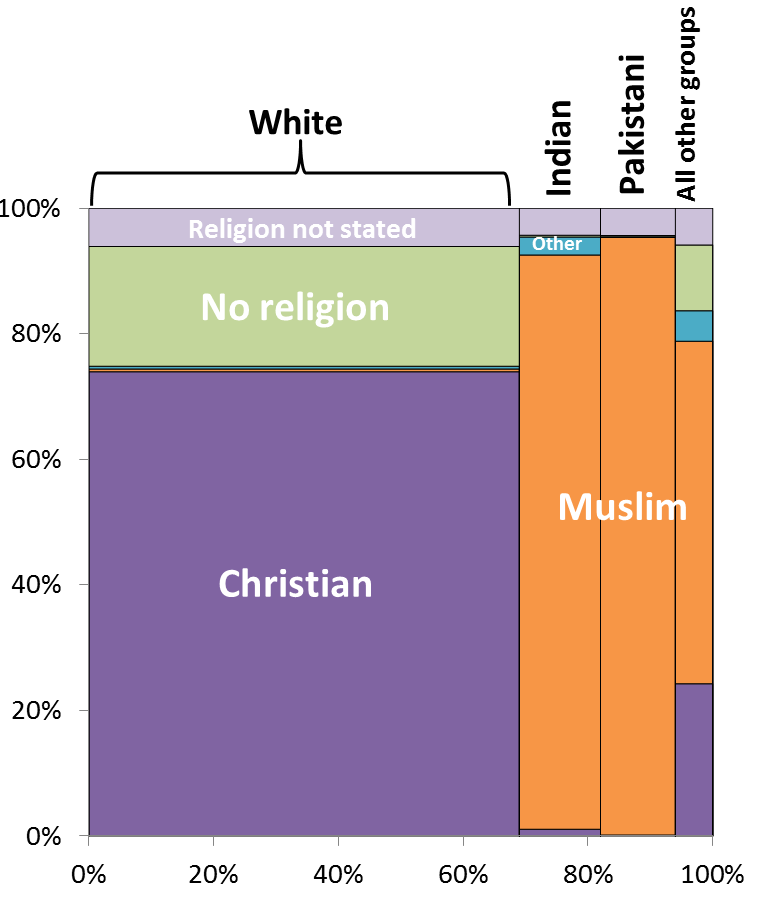
Figure 6: Relationship between ethnicity and religion in Blackburn with Darwen
Language
For the first time, the 2011 Census asked about the ‘main language’ of everybody aged 3 or above. Over 86% of Blackburn with Darwen residents had English as their main language, but a multitude of other languages were also represented: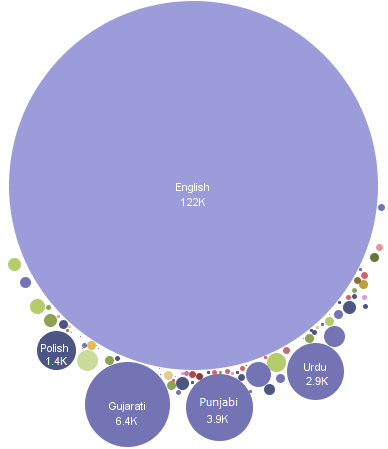
Figure 7: Main language of Blackburn with Darwen residents aged 3+
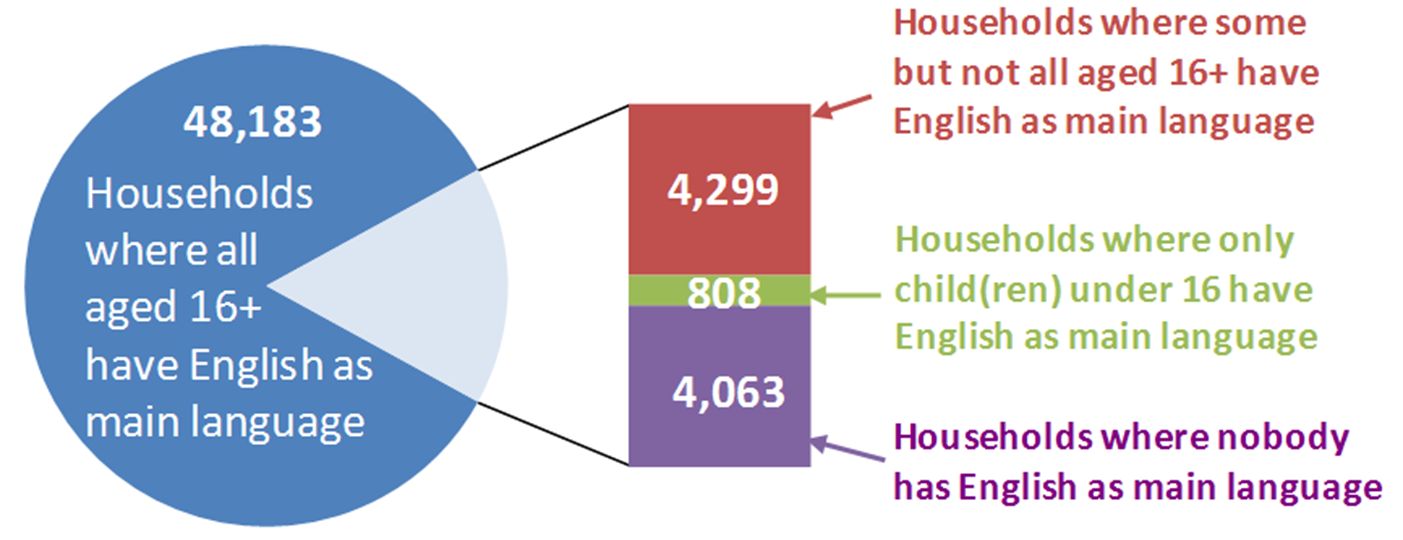
Figure 8: Main language by household
However, it is important to appreciate that many of those with a main language other than English nevertheless speak English ‘well’ or ‘very well’. Only 973 people in the borough could not speak it at all.
Deprivation
The 2015 Index of Mutiple Deprivation (5) is still in use in 2018 (but expected to be replaced in Summer 2019). It is based on 37 indicators, mostly dating from around 2012/13.
Deprivation at the Lower Super Output Area (LSOA) level
The Index of Multiple Deprivation (IMD) is calculated for small neighbourhoods known as Lower Super Output Areas (LSOAs). Figure 9 shows IMD 2015 mapped for Blackburn with Darwen’s 91 LSOAs. Nearly half (45 out of 91, or 49%) of the Borough’s LSOAs are in the worst two national deciles. By definition, each national decile accounts for 10% of all the LSOAs in England, so Blackburn with Darwen has well over its ‘fair share’ of deprived LSOAs.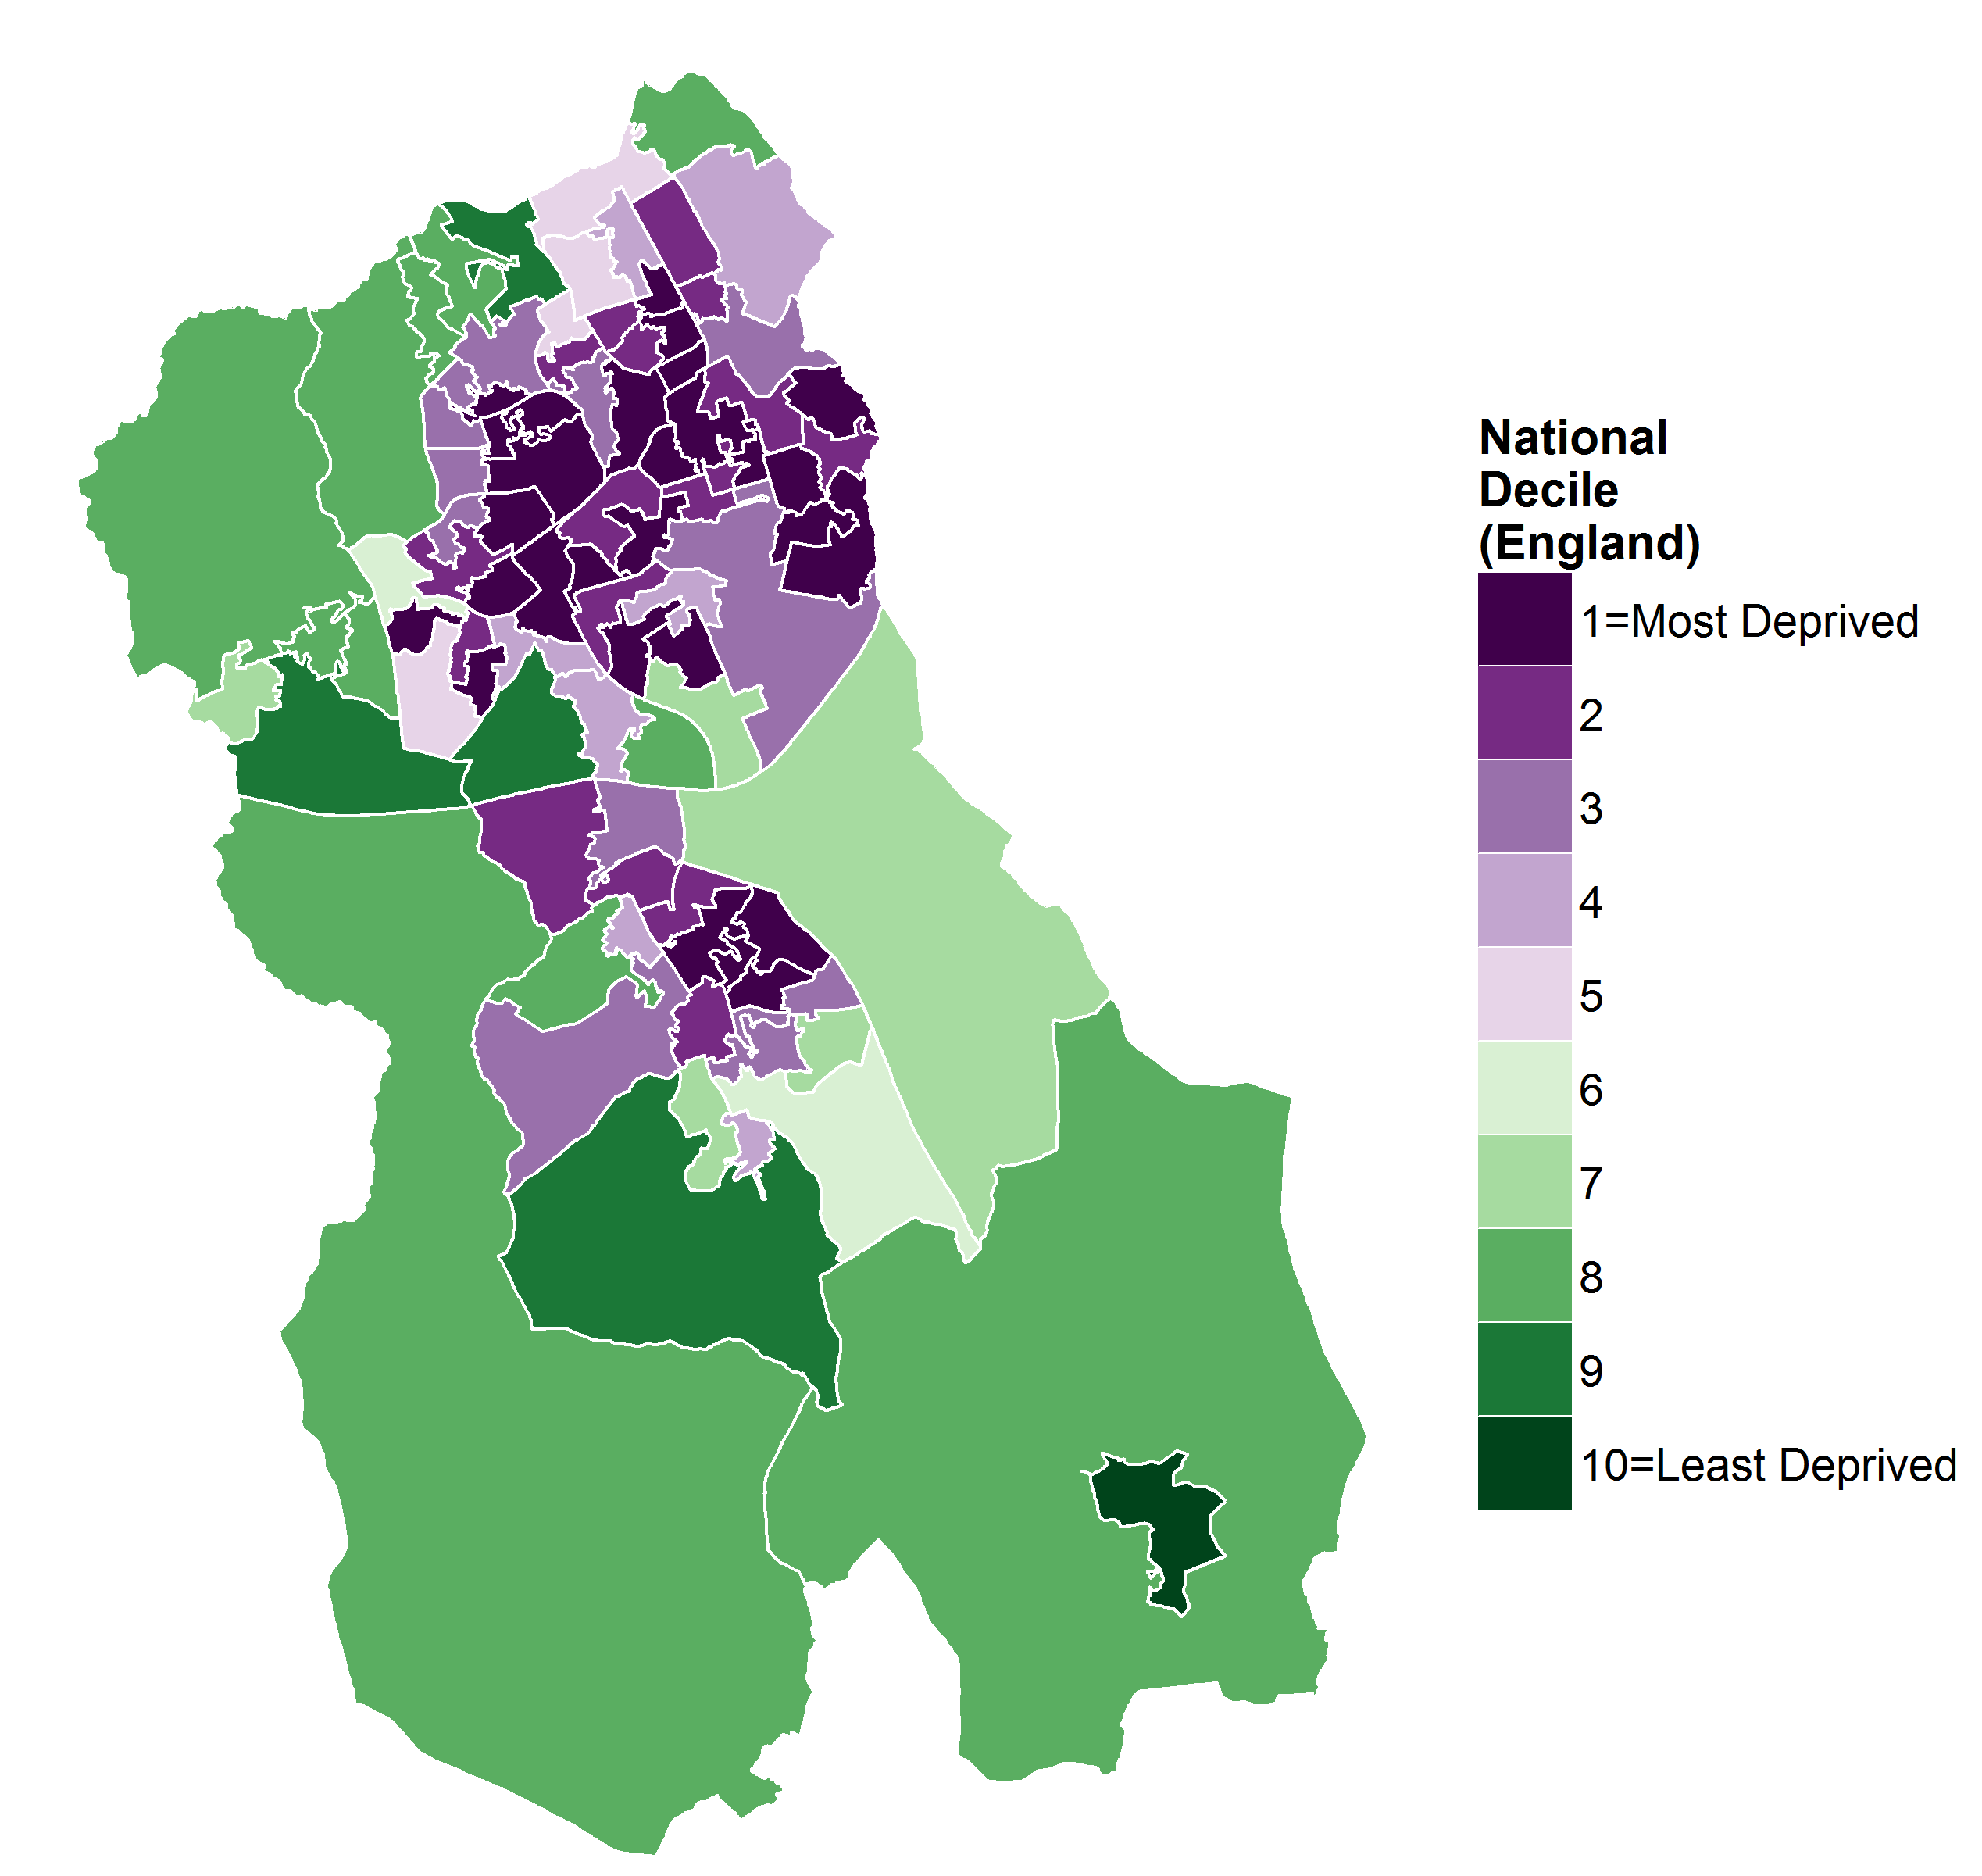
Figure 9: Index of Multiple Deprivation (IMD) 2015
Deprivation at the Borough level
There are various ways of summarising deprivation at the borough level. For example, the ‘Rank of Average Score’ method ranks authorities according to the average IMD score of their LSOAs. On that basis, Blackburn with Darwen ranks as 15th most deprived in 2015.
However, the summary indicator which is now most widely quoted is the proportion of LSOAs in the borough falling within the 10% most deprived in England (i.e. in National Decile 1). In Blackburn with Darwen, that proportion was 31% in 2015, which makes it the 12th most deprived borough.
Destitution
‘Destitution’ is a strong word, but the Joseph Rowntree Foundation estimates that over 1.5 million people in the UK were affected in this way at some point during 2017 (6). It defines ‘destitution’ as being on an extremely low income, and/or unable to afford two or more of the listed essentials over the past month:
- Shelter (had slept rough for 1+ nights
- Food (have had < 2 meals a day for 2+ days)
- Heating (have been unable to heat their home for 5+ days)
- Lighting (have been unable to light their home for 5+ days)
- Clothing and footwear (appropriate for weather)
- Basic toiletries (soap, shampoo, toothpaste, toothbrush)
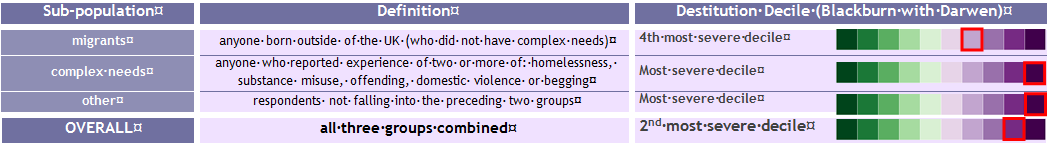
A survey of crisis service users in various parts of the country was used to produce modelled estimates for every local authority. Authorities are ranked on their estimated destitution levels for each of three separate sub-populations (‘migrants’, ‘complex needs’ and ‘other’), and for all three groups put together. Blackburn with Darwen is in the most severe decile of destitution for two out of the three individual sub-populations. It just escapes being in the top decile for destitution overall, but only by one place (7).
Life Expectancy
Life expectancy in Blackburn with Darwen not only lags behind England (see shaded areas in Figure 10), but has plateaued in recent years for males, and actually fallen significantly since 2012-14 for females. In 2015-17, the borough had the 5th lowest life expectancy in England for females, and the 9th equal lowest for males, out of 324 lower-tier local authorities.
Figure 10: (interactive) Life expectancy in England and Blackburn with Darwen
Even at a national level (green lines in Figure 10), the rate of improvement in life expectancy is much slower than it was. There are also widening inequalities between more and less deprived areas of England, with female life expectancy in the most deprived areas actually falling. In a report on these changing trends, Public Health England concludes that they are likely to be due to a number of factors rather than any single cause (8).
There is also striking inequality in life expectancy within Blackburn with Darwen (Figure 11). To illustrate this, Public Health England has ranked the borough’s LSOAs by IMD score, divided them into ten equal groups (‘deciles’) of deprivation, and calculated the life expectancy for each (9). Allowing for rounding error, the difference between the most and least deprived tenths of the borough was 12.4 years for males in 2015 - 17. For females, it was 8.4 years.
Figure 11: (interactive) Life expectancy by deprivation decile
(showing 95% confidence intervals)
Blackburn with Darwen, 2015 - 17
Premature Mortality
The inequalities between more and less deprived parts of the borough are also illustrated in the PHE Health Profile for Blackburn with Darwen (10). The gap in premature death rates is particularly stark for men:
Figure 12: (interactive) Premature mortality (under 75, Male & Female)
for England, Blackburn with Darwen,
& most/least deprived quintiles of Blackburn with Darwen
Local Economy
Any analysis of health and social care needs would be incomplete without a quick introduction to the local economy, not only because it helps to set the context, but also because the economy is a major determinant of health.
Skills
In the year to Dec 2018, there were estimated to be 11400 people aged 16-64 in Blackburn with Darwen with no qualifications, or 12.4% of the working-age population (England 7.6%) (4). Clearly such a high rate (ranking 13th among 149 upper-tier authorities) is undesirable. Data from Nomis provides a stark illustration of the relationship between lack of qualifications and the employment rate (Figure 13) (4).
Figure 13: (interactive) Relationship between employment rate
and lack of qualifications (year to Dec 2018)
Blackburn with Darwen v. other Upper-Tier Authorities in England (4).
At the other end of the spectrum, 22.9% of people aged 16-64 in Blackburn with Darwen had a degree or equivalent in the year ending Dec 2018. This is still well below average (England 32%), and ranks 38th lowest out of 150 upper-tier authorities, but it continues a gradually improving trend (4).
The proportion of the borough’s 19-year-olds qualified to Level 3 (i.e. two A-levels or equivalent) has also shown steady improvement over the years (Figure 14) (11).
Figure 14: (interactive) Level 3 qualification at age 19 (11).
Economic Activity
As seen in Figure 15, an estimated 67.3% of the borough’s residents aged 16-64 are employed (4). This is the 10th lowest rate out of 150 upper tier local authorities (not including the City of London and Scilly Isles).
Together with those who are officially unemployed (i.e. actively seeking work and available to start), it means that only 70.9% are ‘economically active’, which is the 7th lowest rate in England (again not including the City of London or Scilly Isles).
Figure 15: (interactive) Economic activity & employment rate
(age 16-64, year ending Mar 2019) (4)
Looking for Work
Unemployment
Strictly speaking, unemployment is defined by whether people are actively seeking work and available to start, rather than by any benefits they may be claiming. This can only be ascertained from a sample survey, so the estimates for an area such as Blackburn with Darwen are subject to large confidence intervals (Figure 16). The latest results (for the twelve months to Mar 2019) suggest that there are approximately 3300 unemployed people of working age in Blackburn with Darwen. It is conventional to express this as a percentage of the economically active population, which gives a rate of 4.9%.
Figure 16: (interactive) Unemployment rate (age 16-64),
Blackburn with Darwen, North West and England
(showing 95% confidence intervals for BwD)(4)
Claimant Count
It is obvious from Figure 16 that it would be useful to have a proxy for the official unemployment count, which does not depend on a survey. For many years, that need was met by the Claimant Count. Since the introduction of Universal Credit, however, things have not been quite so simple.
The Claimant Count now consists of the (diminishing) number of people still on Job Seekers Allowance, plus those claiming Universal Credit who are required to seek work (12). It is available on this basis going back to April 2015 (Figure 17). The latest Claimant Count total for the borough (in June 2019) was 4410. As a percentage of the working-age population (not just the economically active), this gives a rate of 4.7%.
Figure 17: (interactive) Claimant Count as a % of residents aged 16-64 (4)
Impact of Universal Credit ‘Full Service’
However, Figure 17 must be interpreted with caution. As Universal Credit is rolled out, the rules about who is required to seek work in order to receive benefit keep changing. This makes it difficult to interpret trends in the Claimant Count, and has led ONS to demote it to an ‘Experimental Statistic’.
Judging by Figure 17, it might be thought that the Blackburn with Darwen economy has taken a turn for the worse since February 2018. However, that is not necessarily the case, because in February 2018, the borough became a ‘Full Service’ area for Universal Credit.1 More people are required to seek work under Universal Credit than under the legacy benefits that it replaces, so the recent sharp rise in the Claimant Count may well reflect the fact that the ‘goalposts’ have moved. A similar sharp rise was seen in areas which moved to Full Service last year (2017) (12).
Claimant Count Across the Borough
The fact that it is difficult to interpret the trend in the Claimant Count does not prevent us from looking at how it varies across Blackburn with Darwen at a snapshot in time. Figure 18 shows how the rate as at June 2019 ranged from 1% to 9% across the Borough’s 18 Middle Super Output Areas (MSOAs).
Figure 18: (interactive) Claimant Count rates at MSOA level, June 2019,
as a % of residents aged 16-64
(using mid-2017 population estimates) (4)
Employment by Sector
Both locally and nationally, the biggest sector for employment is Health (Figure 19). Health, Education and Public Admininstration together account for just over a third of Blackburn with Darwen employees, compared with a national average of just over a quarter. 16.4% of employees in Blackburn with Darwen work in Manufacturing, which is more than twice the England average of 8.1%.
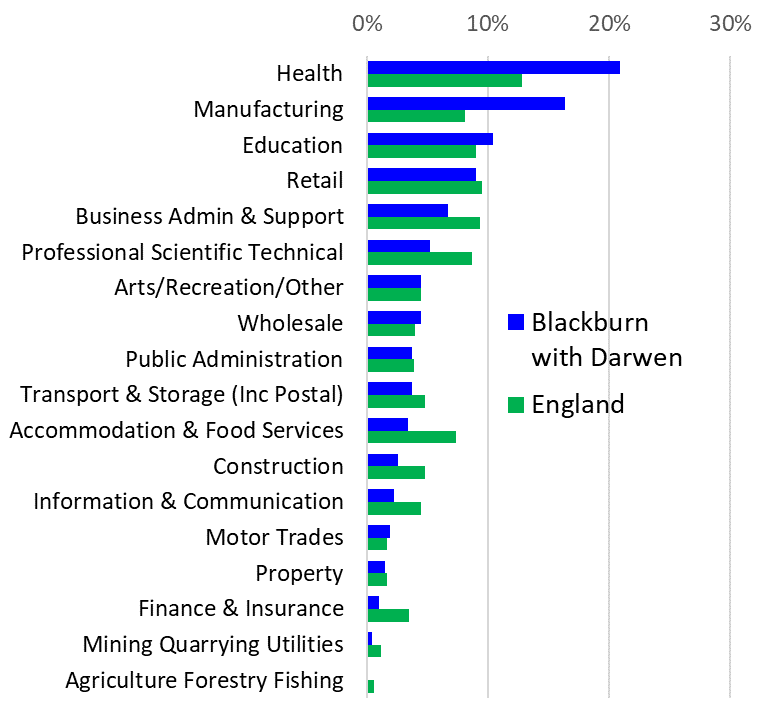
Figure 19: Employees by sector -
Blackburn with Darwen compared with England (2017)
Source: BRES data from Nomis (4)
Productivity
Productivity describes the ability to produce outputs from a given amount of inputs such as labour. Economic output can only be increased by raising the amount of inputs (e.g. employees) or by raising their productivity, so productivity is vital to improving standards of living (13).
The preferred sub-regional measure of productivity is Gross Value Added (GVA) per hour worked. On this basis, Blackburn with Darwen has the 12th lowest productivity out of 168 ‘NUTS 3’ areas in the UK (Figure 20), at 77.6% of the UK average (13).
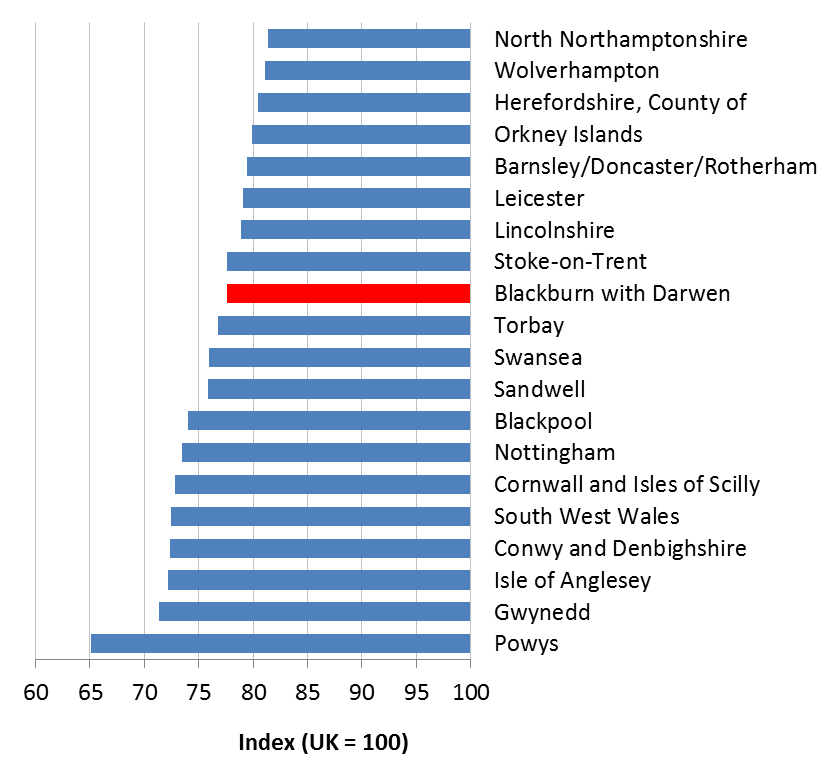
Figure 20: Productivity (GVA per hour worked) -
20 lowest ranking NUTS3 areas, relative to UK (2016)
Earnings
Provisional median gross weekly earnings for Blackburn with Darwen residents in 2018 were £383. This puts Blackburn with Darwen 8th lowest out of 151 upper-tier authorities in England (Figure 21) (4).
Figure 21: (interactive) Provisional Median Gross Weekly Earnings of residents -
Blackburn with Darwen v. other Upper-Tier Authorities in England (2018) (4)
Household Income
Gross Disposable Household Income
Gross Disposable Household Income (GDHI) is the amount of money that individuals in households have available for spending after taxes and benefits. Provisional estimates for 2017 are now available by local authority (14).
The Blackburn with Darwen average of £12,623 per head is the 3rd lowest in the UK (after Nottingham and Leicester), and the lowest in the North West. It compares with an England average of £19,988. Blackburn with Darwen has consistently been in 2nd or 3rd lowest place for the past seven years.
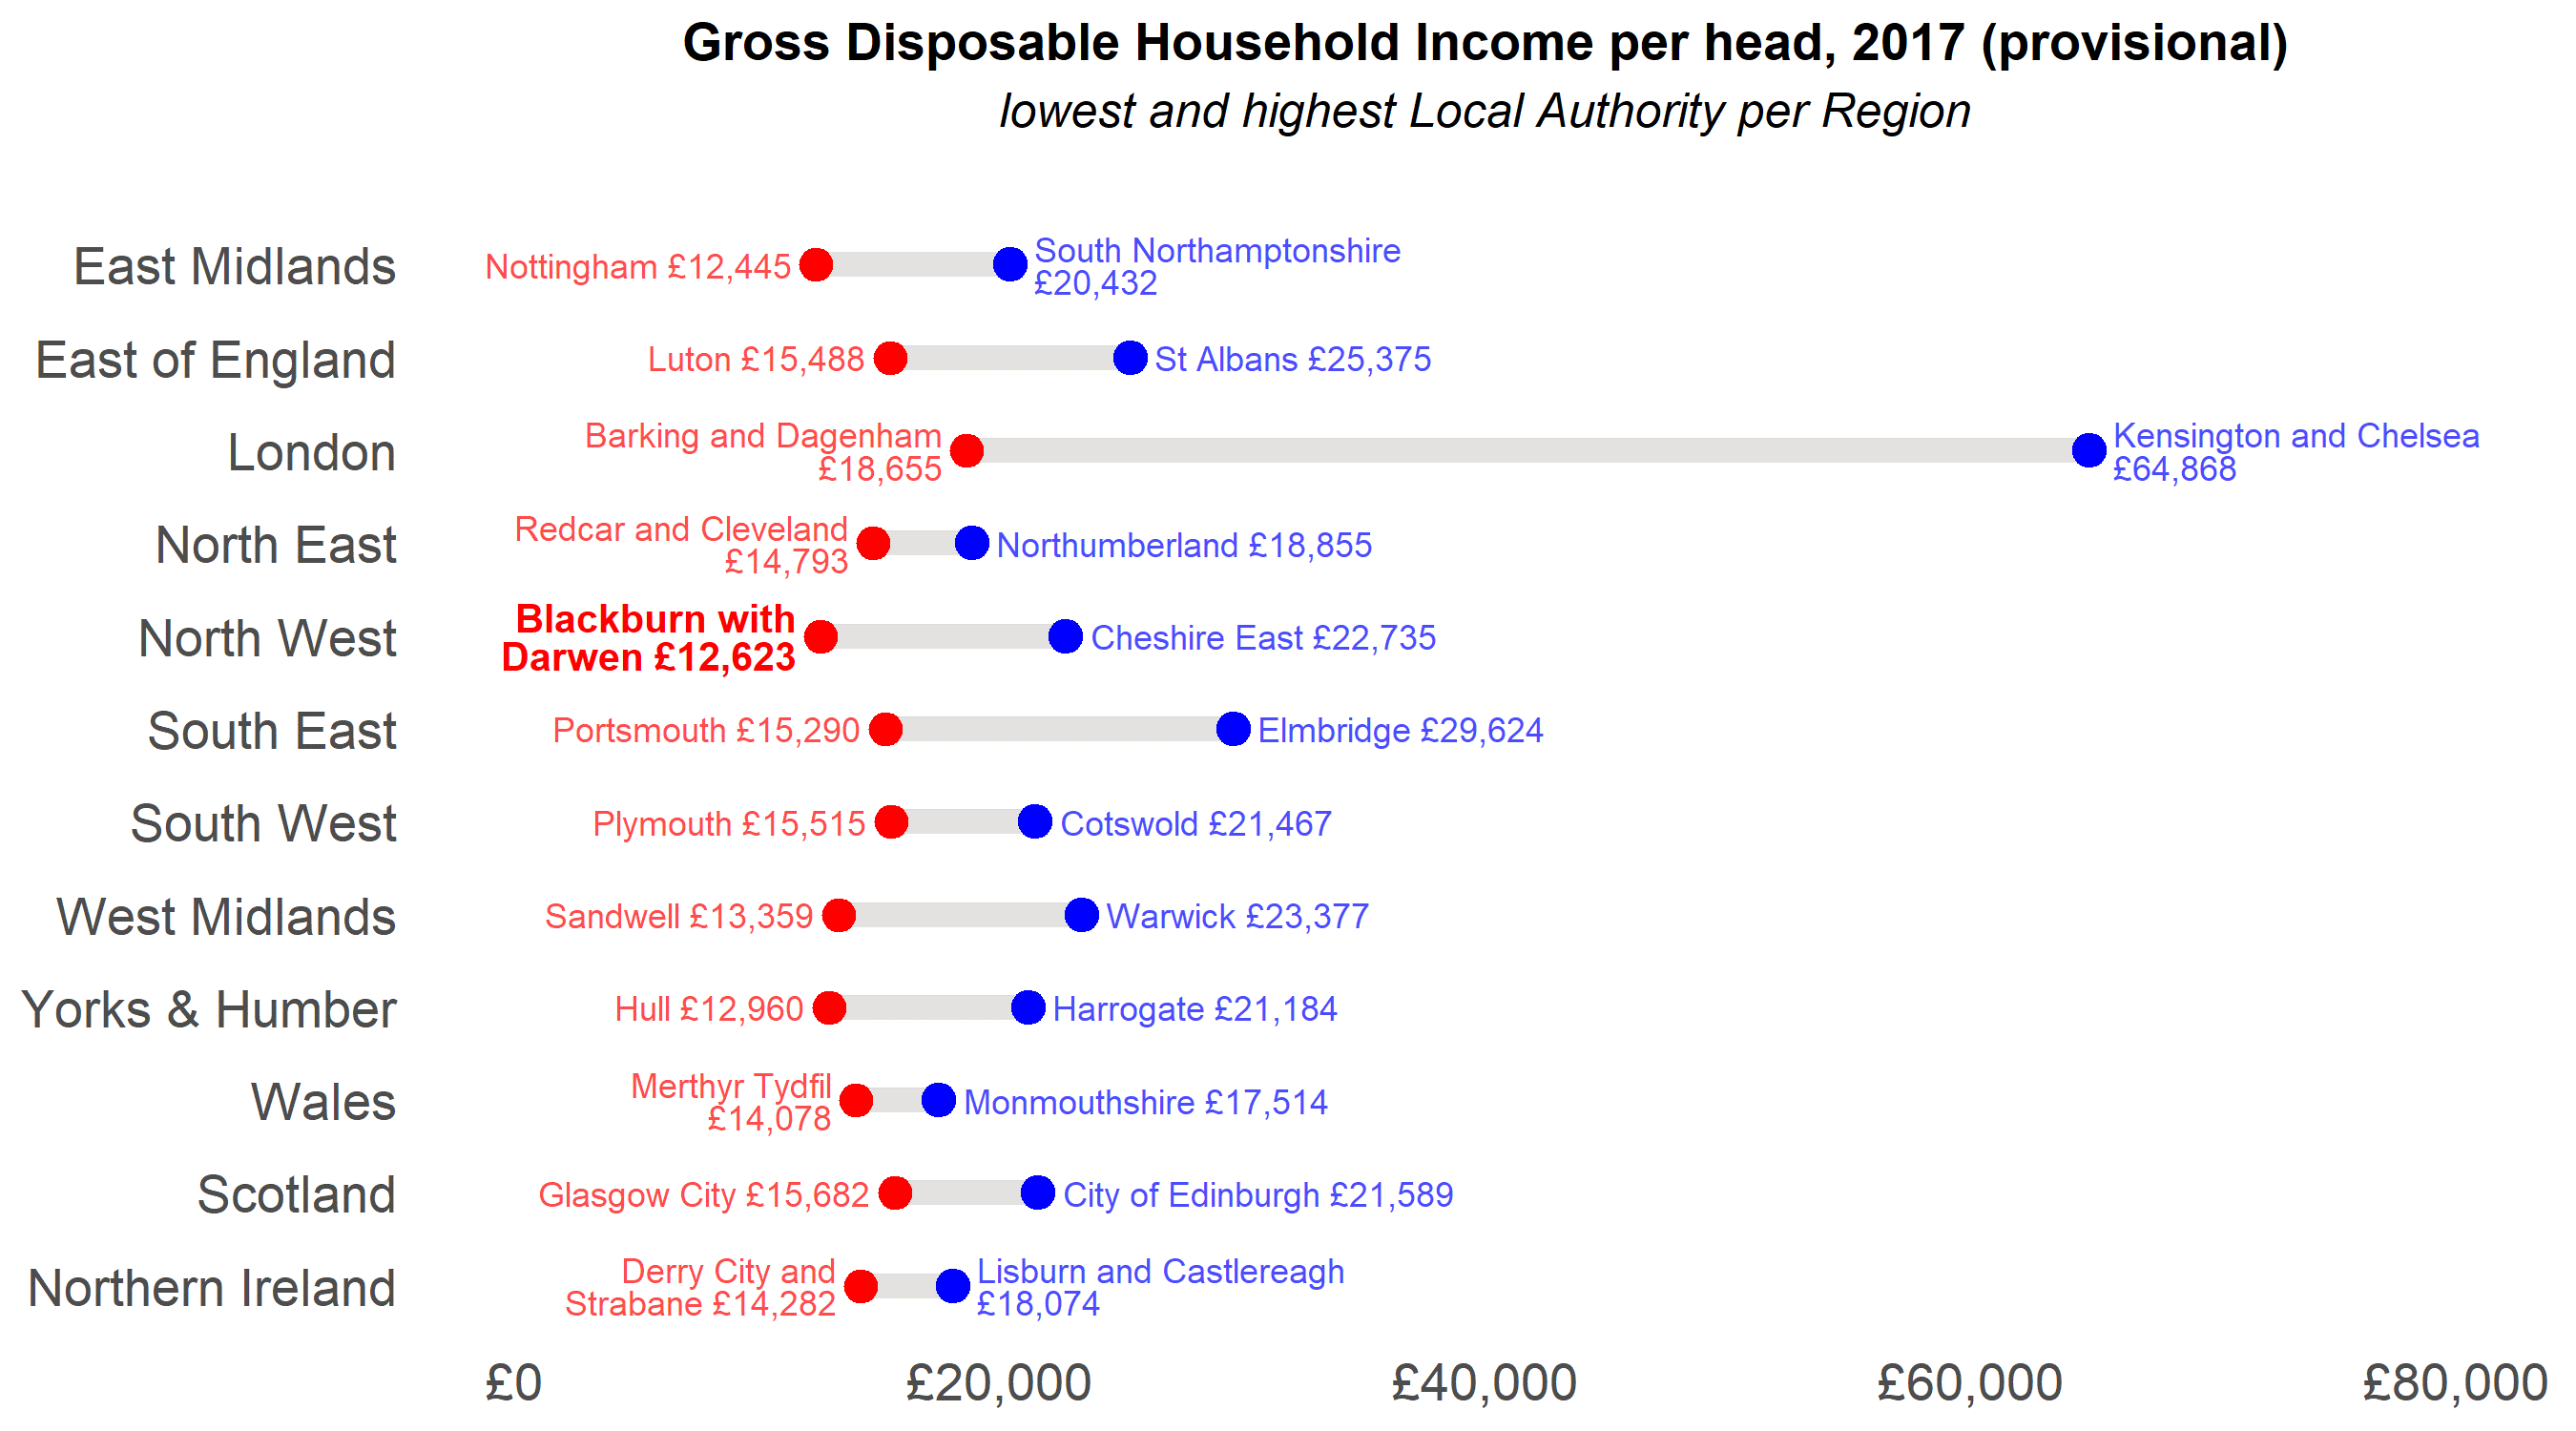
Figure 22: Gross Disposable Household Income per head (2017, provisional):
lowest and highest local authority per region
Total Household Income
ONS also issues various modelled estimates of household income at the smaller Middle Super Output Area (MSOA) level (15). Figure 23 shows a map of how Total Annual Household Income (before tax) varies across the borough.
Half of Blackburn with Darwen’s 18 MSOAs are in the bottom national decile for household income (darkest purple), with estimated average incomes ranging from £20,100 to £29,100. Eight of them form a broad swathe across Blackburn. The lowest of all is in Audley, and this MSOA ranks third lowest in England (out of 6791). The next lowest MSOA in Blackburn with Darwen, covering the town centre area, ranks 11th lowest in England. By contrast, Blackburn with Darwen also has one MSOA in the second-highest national decile (dark green), with an estimated average of £51,500.
It is stressed that these are only estimates, with a wide degree of uncertainty around them.
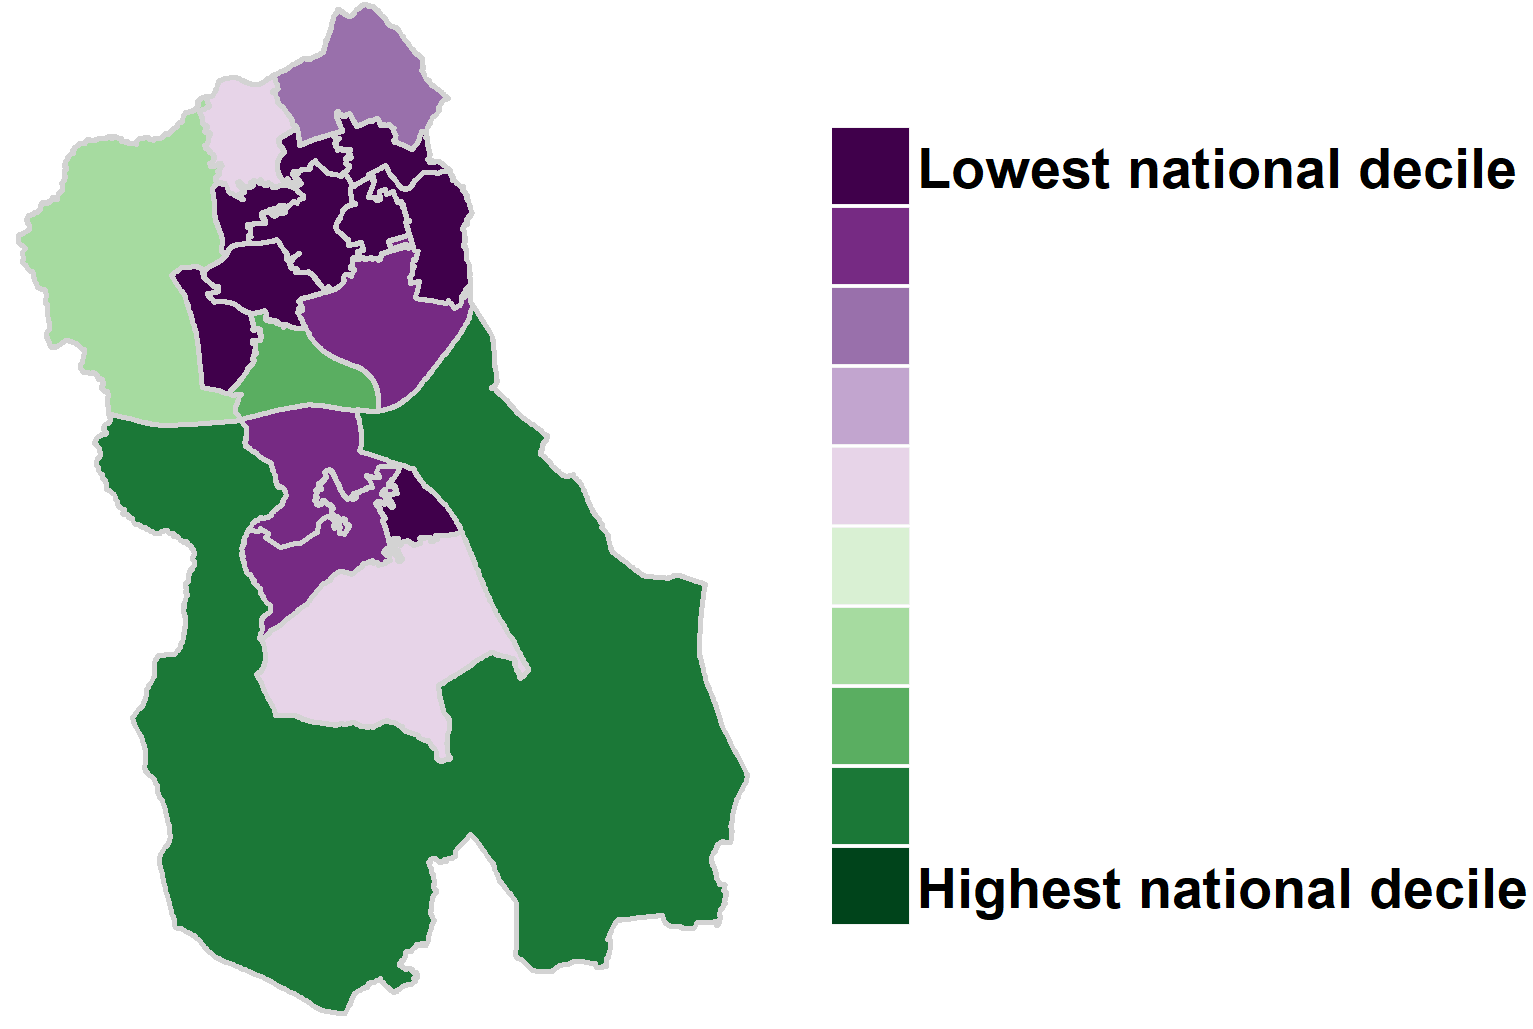
Figure 23: Estimated Total Annual Household Income (MSOAs, 2015/16)
NB- measured per household, not per head
Safe and Healthy Homes
and Neighbourhoods
Housing
Private Rented Sector
“The private-rented sector in the UK is growing and has worse housing conditions than any other sector.”
— Parliamentary Office of Science & Technology [POST]
Housing Conditions
Evidence from the English Housing Survey shows that the private rented sector nationally has the highest rate of serious (‘Category 1’) hazards, the highest proportion of houses with poor energy efficiency ratings, and the highest prevalence of damp (Figure 24) (16). Private rented housing was also the most likely to be old, to be non-decent (a broader classification, including problems of disrepair and ageing facilities), and to be suffering from damp (17,18).
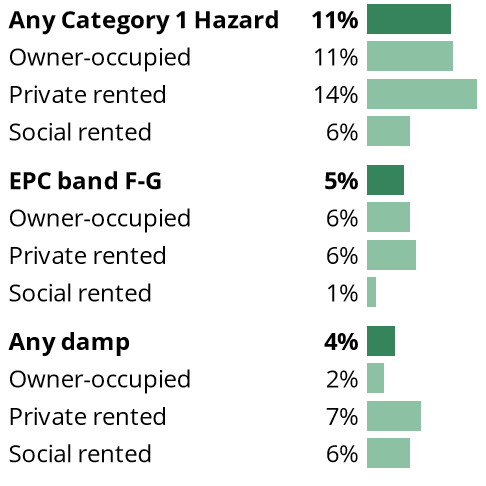
Figure 24: National findings from the English Housing Survey (2017) (16)
(‘EPC’ = ‘Energy Performance Certificate’)
Local Market
Modelled estimates (which ONS stress are not official statistics) suggest that Blackburn with Darwen had approximately 8875 privately rented houses in 2017 (19). Data from the Valuation Office Agency (VOA) shows that median private-sector rents in Blackburn with Darwen were the 16th lowest in England in 2018-19. The rental for a non-self-contained room was the lowest in the NW (20).
Regulation
‘Houses in Multiple Occupation’ (HMOs) often house some of the most vulnerable people. Since October 2018, mandatory licensing applies to any rented property occupied by 5+ unrelated people, sharing facilities such as a kitchen, toilet or bathroom (Figure 25).
Selective licensing schemes for private rented housing can be an effective tool for driving up standards and reversing neighbourhood decline in areas of low demand. Blackburn with Darwen has one such scheme in Darwen, and one in the Infirmary area of Blackburn (Figure 25) (21,22).
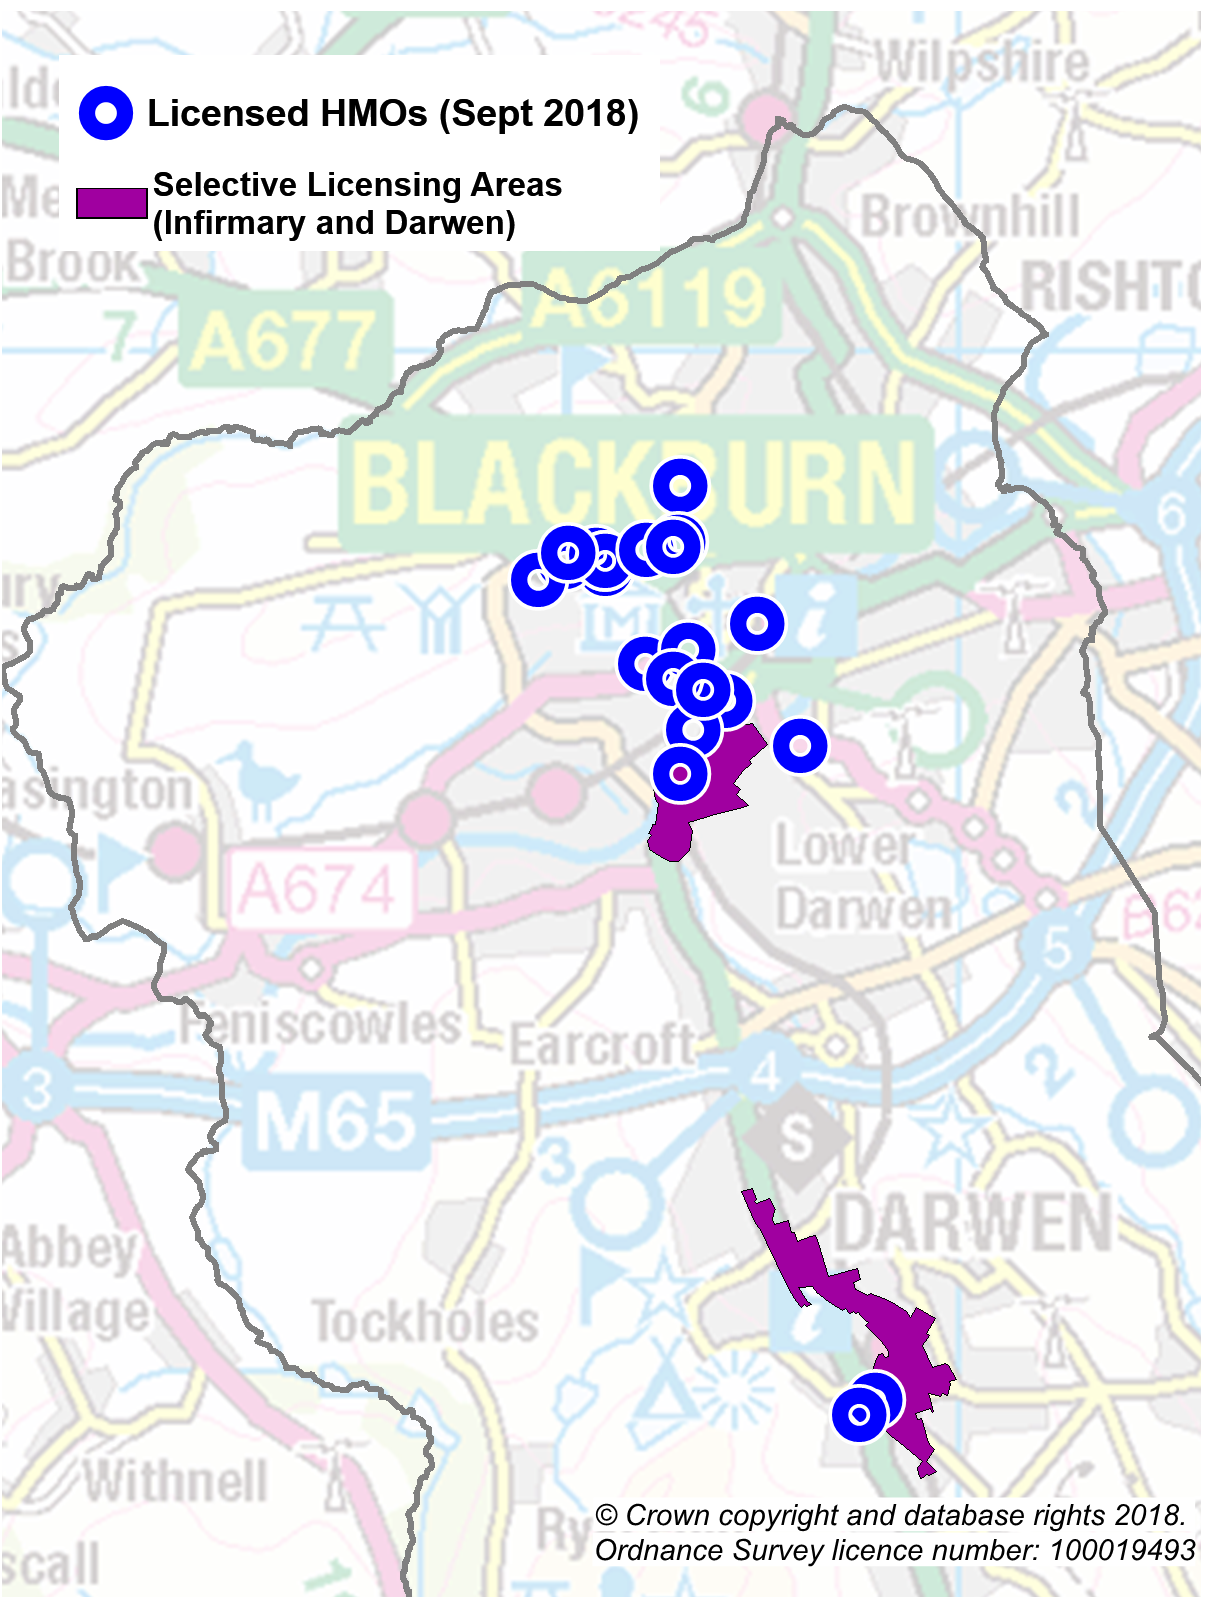
Figure 25: Licensed HMOs & Selective Licensing Areas in BwD
Cold housing and Fuel Poverty
As well as being a major contributor to excess winter deaths, cold housing adds to the burden of circulatory and respiratory disease, colds and flu, exacerbates chronic conditions such as rheumatism and arthritis, and has a negative effect upon mental health (23).
An estimated 9895 households in Blackburn with Darwen (16.5%) were classed as being in ‘fuel poverty’ in 2017, putting it 6th highest (England 10.9%, North West 13.1%). Figure 26 shows how these estimates vary across the borough (24,25). However, ONS is now suggesting a different estimation method, which would put Blackburn with Darwen on 15.2%, or 23rd in the country (26). This is ‘experimental’ at the moment, but may become official in future.
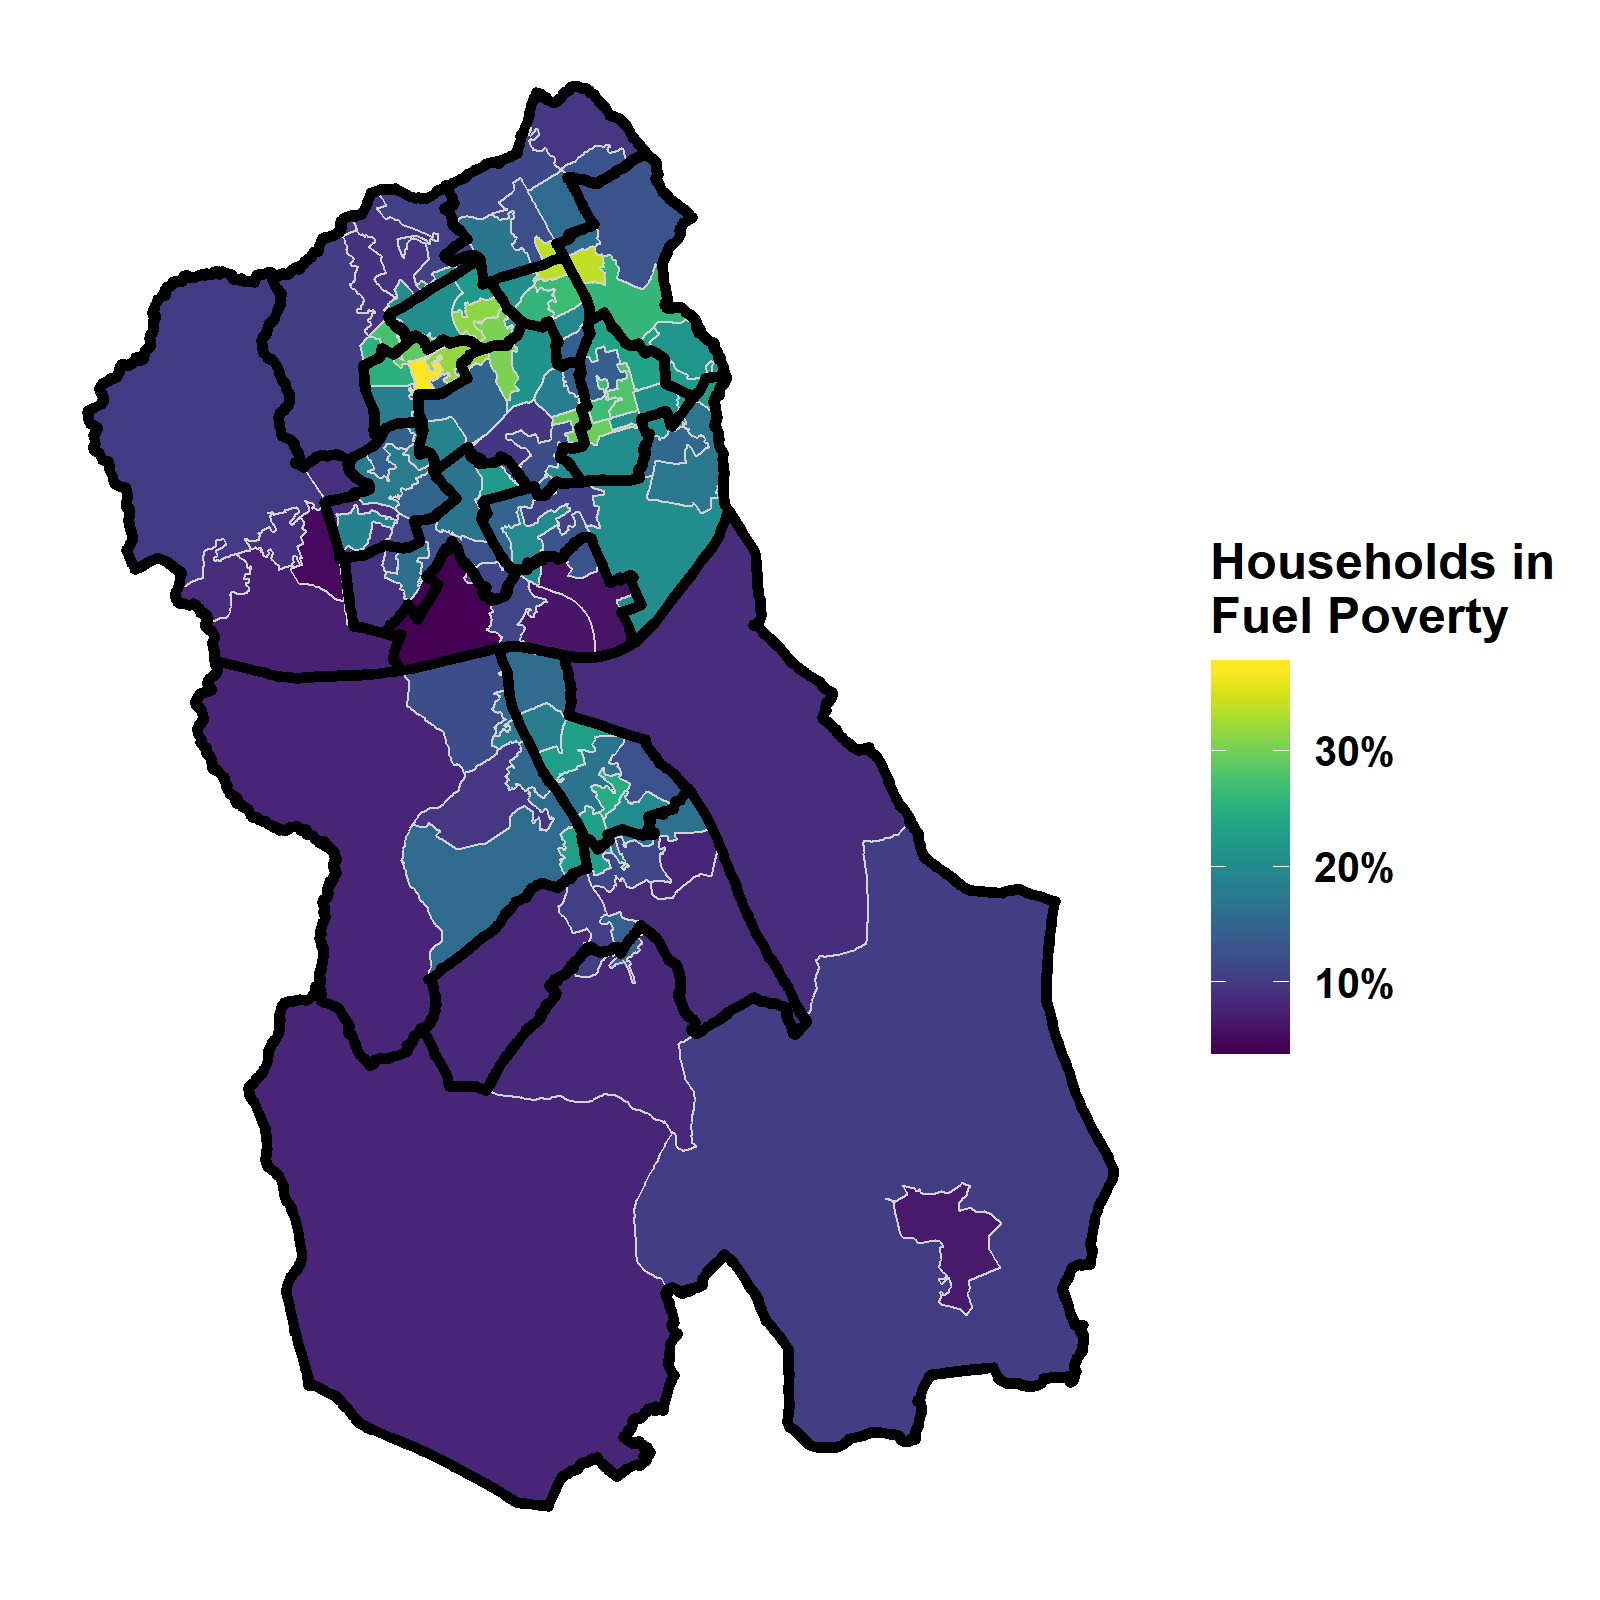
Figure 26: Households in Fuel Poverty, 2017 (modelled estimates)
Lower Super Output Areas overlaid with wards, Source BEIS
Blackburn with Darwen does its best to promote energy efficiency and available grants via initiatives such as its ‘Heat and Eat’ events (27), and marked Fuel Poverty Awareness Day by holding ‘Blackburn with Darwen’s Biggest Housewarming’ event (Figure 27) (28).
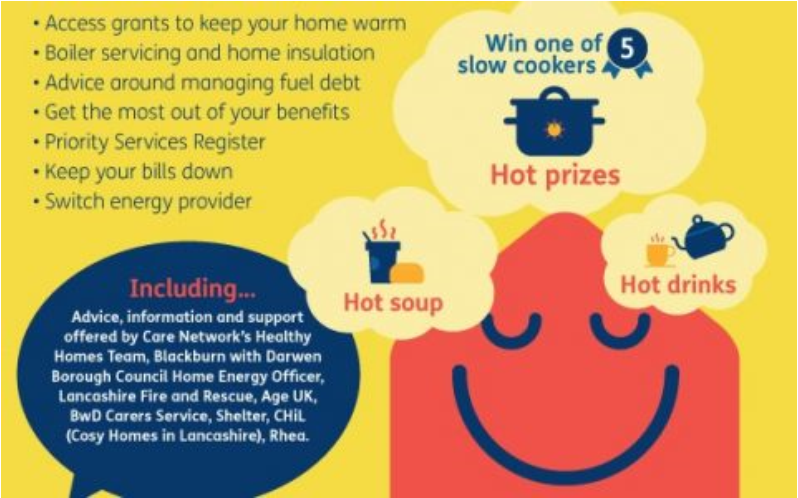
Figure 27: Blackburn with Darwen’s “Biggest Housewarming Event”
(Fuel Poverty Awareness Day, 2019)
Crime and Violence
Crime and Antisocial Behaviour
Data about the type and whereabouts of every recorded incident of crime or antisocial behaviour is available from http://data.police.uk/. In Figure 28, the darkest pink shading denotes the areas with the greatest number of incidents in the year to December 2018.2
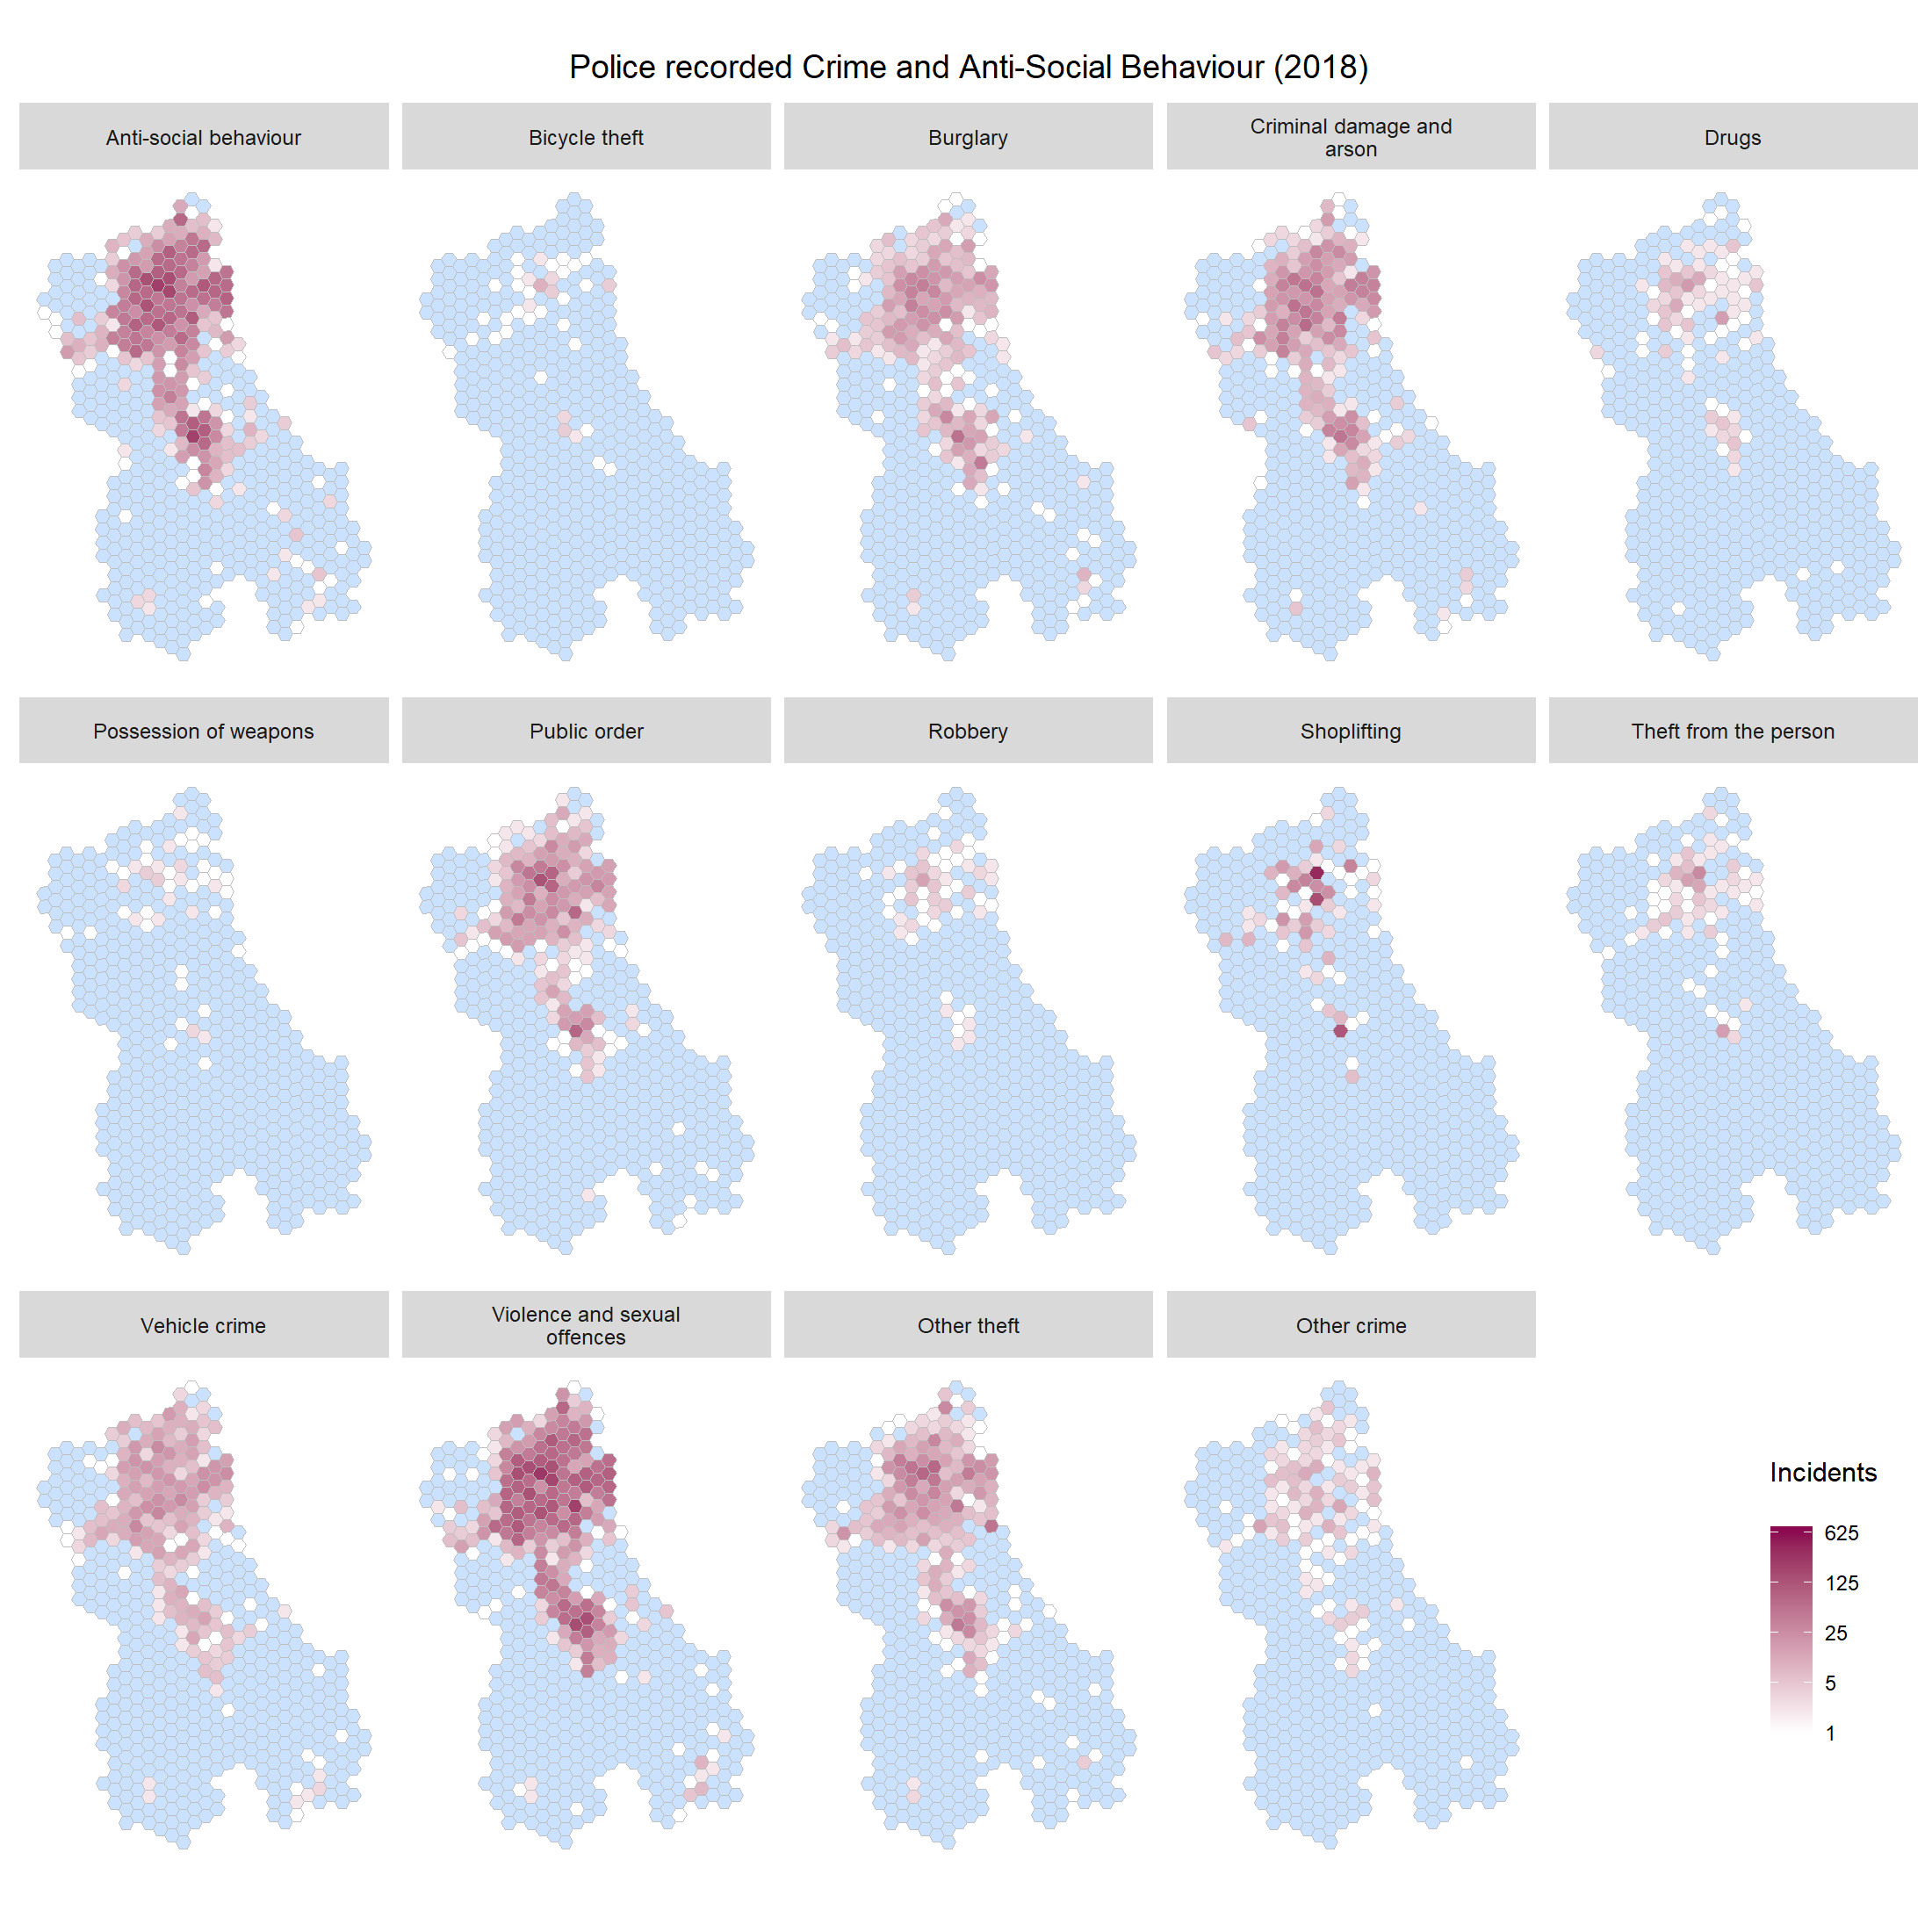
Figure 28: Locations of recorded Crime and Antisocial Behaviour (January - December 2018)
Only includes crimes with a recorded type and location, and hexagons lying entirely within BwD
Violent and Sexual Offences
The Public Health Outcomes Framework (29) monitors the rate of violent crime and the rate of sexual offences. In 2017/18, both rates were higher than average in Blackburn with Darwen. They were also both rising, but this was the case in every NW district. Public Health England does not feel it is appropriate to rag-rate these indicators, as high or low levels could be due to high or low levels of recording. The borough also had the 18th highest rate nationally of hospital admissions for violence in 2015/16 – 2017/18.
Fast Food Outlets
Number and density
‘CEDAR’ Estimates
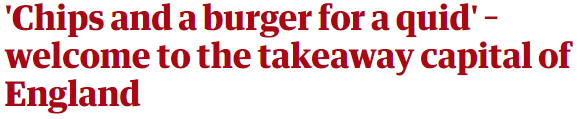
Blackburn with Darwen became briefly notorious as the ‘takeaway capital’ of England in July 2017, when research from the ‘CEDAR’ Unit at Cambridge University (30) gave rise to newspaper headlines like the one above (31). Blackburn with Darwen’s 236 takeaways were not (quite) the highest number per head (that honour went to Westminster). However, they did represent the highest number of takeaways as a proportion of all food outlets in the borough (38%).
A subsequent Guardian article, also based on data from CEDAR, found that 400 schools in England had 20 or more fast food outlets within a 400m radius. St Anne’s School, in the centre of Blackburn, was said to be in the top ten, with 46 nearby outlets (32).
PHE Estimates
Since then, Public Health England (PHE) has published its own analysis, using a different data source and definition.3 The PHE data shows Blackburn with Darwen to have 219 ‘fast food outlets’ as at 31st December 2017 (Figure 29) (33). This equates to 147.5 outlets per 100,000 population, which is the 13th highest density in the country. By comparison, the England average is 96.5, and the maximum (in Blackpool) is 232.2.
PHE’s density map shows a clear north-south divide (Figure 29), and a strong link with deprivation. As well as Blackburn with Darwen, Burnley and Hyndburn also rank highly. PHE also provides ward-level counts, which let us see where the borough’s 219 fast food outlets are concentrated.
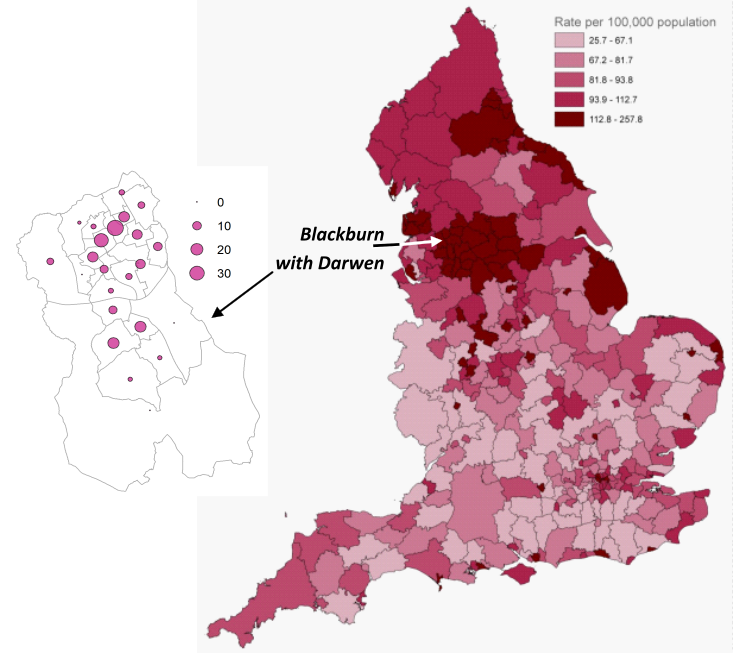
Figure 29: Fast Food Outlets per 100,000 population (right)
and counts per pre-2018 ward (left)
December 2017 (33)
Evidence and policy
Giving evidence to the recent House of Commons Childhood Obesity Inquiry, the CEDAR team at Cambridge University drew attention to the typical cheapness, high-calorie content and large portion size of takeaway food, and the concentration of fast food outlets in deprived areas. They concluded that takeaways were linked to obesity (and to inequalities in obesity) in a way that supermarkets and restaurants were not (34). Public Health England has also alluded to the ‘growing body of evidence’ connecting fast food outlets to obesity (33).
Blackburn with Darwen’s ‘Eat Well Move More Shape Up’ strategy acknowledges how fast food outlets are over-represented in deprived areas, the temptation they pose to young people in particular, and the need for tighter controls to regulate their growth (35). Since April 2016, the borough has operated a policy of refusing permission for new takeaways within 400m of any primary or secondary school, madrassa, nursery or college, unless there are fewer than five such establishments already and the proposed opening hours are outside those of the educational institution (36).
Wellbeing and Social Mobility
The Social Mobility Index
The Social Mobility Commission has updated its Social Mobility Index (37), designed to identify places where people from disadvantaged backgrounds are more or less likely to make social progress during their lives. The Index is based on educational attainment before, during and after the school years, and the outcomes achieved by adults in terms of income, job status and home ownership.
Overall Index
On the overall Social Mobility Index, Blackburn with Darwen sits almost exactly mid-table, ranking 161st out of 324 English lower-tier local authorities (where 1st is best). The authors of the report detect a growing gap between social mobility ‘hotspots’ and ‘coldspots’, with London pulling further ahead of the rest of the country. Prospects for disadvantaged people tend to be worst in remote, coastal or rural areas, and formerly industrial districts.
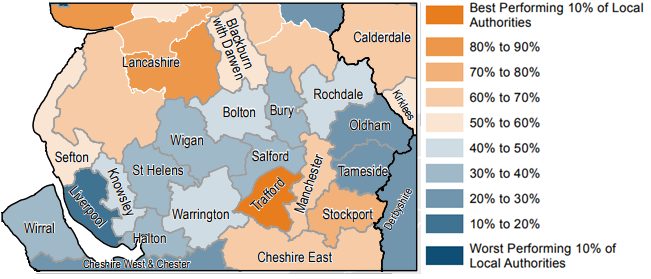
Figure 30: Social Mobility Index 2017 (overall ranking)
Life Stage Indices
The overall Social Mobility Index is made up of four life-stage Indices, each based on between 2 and 5 indicators. Figure 31 gives an overview of Blackburn with Darwen’s relative performance on each indicator, and for each life-stage as a whole.
Blackburn with Darwen continues to rank as a ‘coldspot’ (well below average) for Early Years social mobility, coming 31st from bottom in the rankings. However it then leaps to 70th best place at School age, and 65th best for Youth. Unfortunately, the borough does not compare so favourably on the economic indicators used to assess Adult social mobility, and it slips back to 82nd from the bottom.
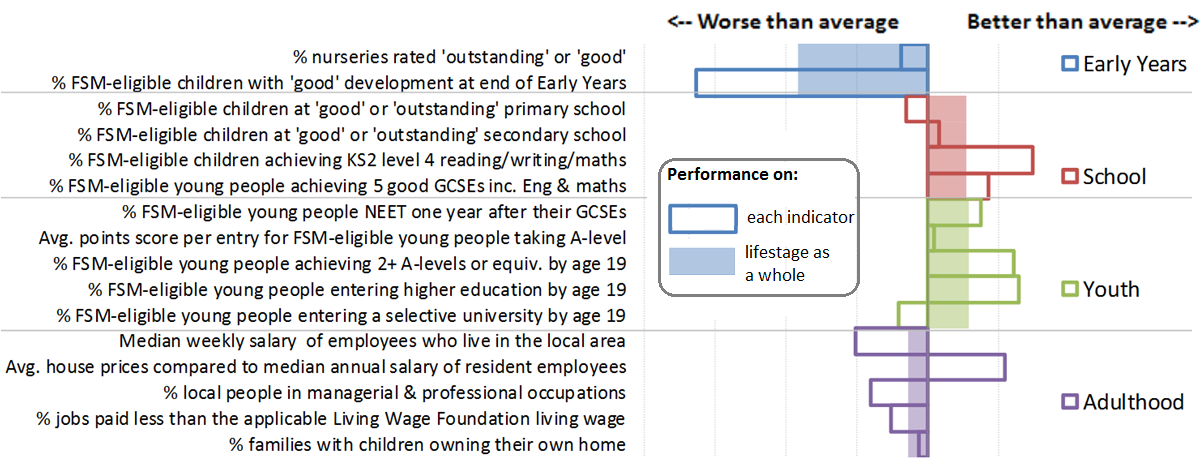
Figure 31: Breakdown of Social Mobility Index for Blackburn with Darwen
Local Wellbeing Indicators
Commissioned by ONS and Public Health England, the new Local Wellbeing Indicator Set was developed by the What Works Wellbeing and Happy City think-tanks, and was first published at the end of 2017 (38). Designed to capture a holistic overview of local wellbeing and its determinants, the 23 indicators have deliberately not been combined into a single index, as the authors feel it is more important for local policy-makers to understand where the gaps and challenges lie.
In Figure 32, Blackburn with Darwen’s score on each indicator is compared with the England average. If the bar points inwards from the ‘England’ circle, Blackburn with Darwen is performing less well than England, and if it points outwards, it is performing better.
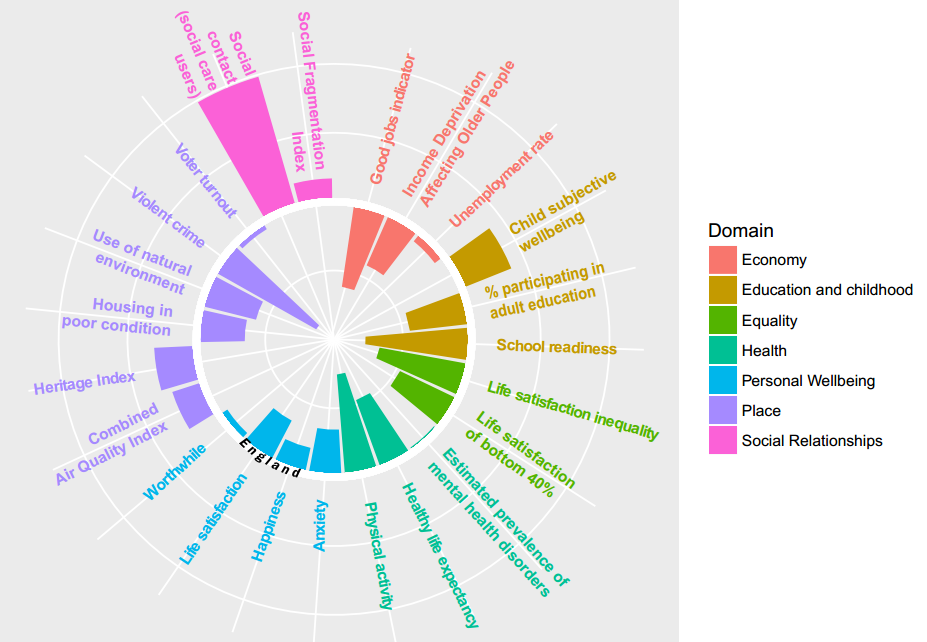
Figure 32: Local Wellbeing Indicators for Blackburn with Darwen
Positive signs
It is clear that Blackburn with Darwen scores below average on the majority of indicators, many of which are picked up on elsewhere in this document. However, there are some notable exceptions. In the 2014 ‘What about YOUth?’ survey, the borough’s children were less likely than average to report low life satisfaction. Blackburn with Darwen has better than average Air Quality (according to the 2015 Indices of Deprivation), and a favourable RSA ‘Heritage Index’ - built up of over 100 different indicators, covering everything from battlefields, to museums, to local delicacies.
It is striking that the borough performs better than average on both indicators in the ‘Social Relationships’ domain (shown in pink in Figure 32). When social care users are asked whether they have as much social contact as they would like, Blackburn with Darwen returns some of the best results in the country. It also has a relatively low ‘Social Fragmentation Index’, which is a census-based measure of the extent to which people live alone, move frequently, and/or live in private rented accommodation.
References
2. ONS. Estimates of the Population for the UK, England and Wales, Scotland and Northern Ireland [Internet]. Office for National Statistics; 2019. Available from: https://www.ons.gov.uk/peoplepopulationandcommunity/populationandmigration/populationestimates/datasets/populationestimatesforukenglandandwalesscotlandandnorthernireland
3. ONS. Subnational population projections: 2016-based projections [Internet]. Office for National Statistics; 2018. Available from: https://www.ons.gov.uk/peoplepopulationandcommunity/populationandmigration/populationprojections/bulletins/subnationalpopulationprojectionsforengland/2016based
4. Nomis [Internet]. 2018. Available from: www.nomisweb.co.uk
5. MHCLG. English indices of deprivation 2015 [Internet]. Ministry of Housing, Communities & Local Government; 2015. Available from: https://www.gov.uk/government/statistics/english-indices-of-deprivation-2015
6. JRF. Destitution in the UK 2018 [Internet]. Joseph Rowntree Foundation; 2018. Available from: https://www.jrf.org.uk/report/destitution-uk-2018
7. Heriot Watt University. Destitution in the UK 2018 - Technical Report [Internet]. 2018. Available from: https://researchportal.hw.ac.uk/en/publications/destitution-in-the-uk-2018-technical-report
8. PHE. A review of recent trends in mortality in england [Internet]. Public Health England; 2018. Available from: https://assets.publishing.service.gov.uk/government/uploads/system/uploads/attachment_data/file/786515/Recent_trends_in_mortality_in_England.pdf
9. PHE. Public health outcomes framework – downloadable data [Internet]. Public Health England; 2018. Available from: https://fingertips.phe.org.uk/profile/public-health-outcomes-framework/data#page/9/gid/1000049/pat/6/par/E12000002/ati/102/are/E06000008/iid/90366/age/1/sex/1
10. PHE. Blackburn with darwen health profile 2018 [Internet]. Public Health England; 2018. Available from: https://fingertips.phe.org.uk/profile/health-profiles
11. DfE. Level 2 and 3 attainment by age 19 [Internet]. 2019. Available from: https://department-for-education.shinyapps.io/attainment-age-19/
12. House of Commons Library. People claiming unemployment benefits by constituency, july 2018. [Internet]. 2018. Available from: https://researchbriefings.parliament.uk/ResearchBriefing/Summary/CBP-8381
13. ONS. Regional and sub-regional productivity in the UK: February 2018 [Internet]. Office for National Statistics; 2018. Available from: https://www.ons.gov.uk/employmentandlabourmarket/peopleinwork/labourproductivity/articles/regionalandsubregionalproductivityintheuk/february2018
14. ONS. Regional gross disposable household income, UK: 1997 to 2017 [Internet]. Office for National Statistics; 2019. Available from: https://www.ons.gov.uk/economy/regionalaccounts/grossdisposablehouseholdincome/bulletins/regionalgrossdisposablehouseholdincomegdhi/1997to2017
15. ONS. Small area income estimates for middle layer super output areas, england and wales [Internet]. Office for National Statistics; 2018. Available from: https://www.ons.gov.uk/employmentandlabourmarket/peopleinwork/earningsandworkinghours/datasets/smallareaincomeestimatesformiddlelayersuperoutputareasenglandandwales
16. House of Commons Library. Debate pack – the cost of unhealthy housing to the national health service [Internet]. 2019. Available from: http://researchbriefings.files.parliament.uk/documents/CDP-2019-0046/CDP-2019-0046.pdf
17. POST. Health in private rented housing [Internet]. Parliamentary Office of Science & Technology; 2018. Available from: http://researchbriefings.files.parliament.uk/documents/POST-PN-0573/POST-PN-0573.pdf
18. MHCLG. Dwelling condition and safety [Internet]. Ministry of Housing, Communities & Local Government; 2018. Available from: https://www.gov.uk/government/statistical-data-sets/dwelling-condition-and-safety
19. ONS. Research outputs: Subnational dwelling stock by tenure estimates, england 2012 to 2017 [Internet]. Office for National Statistics; 2019. Available from: https://www.ons.gov.uk/peoplepopulationandcommunity/housing/articles/researchoutputssubnationaldwellingstockbytenureestimatesengland2012to2015/2012to2017
20. VOA. Private rental market summary statistics – april 2018 to march 2019 [Internet]. Valuation Office Agency; 2019. Available from: https://www.gov.uk/government/statistics/private-rental-market-summary-statistics-april-2018-to-march-2019
21. BwDBC. Infirmary SLA designation report [Internet]. Blackburn with Darwen Borough Council; 2015. Available from: http://www.blackburn.gov.uk/Selective%20licensing/Infirmary%20Selective%20Licensing%20Redesignation%20Report.pdf
22. BwDBC. Darwen SLA designation report [Internet]. Blackburn with Darwen Borough Council; 2017. Available from: http://www.blackburn.gov.uk/Selective%20licensing/Darwen-SLA-Designation-Report-2017.pdf
23. Marmot Review Team. The health impacts of cold homes and fuel poverty [Internet]. 2011. Available from: https://www.instituteofhealthequity.org/projects/the-health-impacts-of-cold-homes-and-fuel-poverty
24. DBEIS. Annual fuel poverty statistics report 2019 [Internet]. Department for Business, Energy & Industrial Strategy; 2019. Available from: https://www.gov.uk/government/statistics/annual-fuel-poverty-statistics-report-2019
25. DBEIS. Sub-regional fuel poverty, 2019 [Internet]. Department for Business, Energy & Industrial Strategy; 2019. Available from: https://www.gov.uk/government/statistics/sub-regional-fuel-poverty-2019
26. ONS. Research outputs: Small area estimation of fuel poverty in england, 2013 to 2017 [Internet]. Office for National Statistics; 2019. Available from: https://www.ons.gov.uk/peoplepopulationandcommunity/housing/articles/researchoutputssmallareaestimationoffuelpovertyinengland2013to2017/2019-07-08#conclusions-and-next-steps
27. Shuttle. Heat and Eat this winter [Internet]. 2018. Available from: https://theshuttle.org.uk/heat-and-eat-this-winter/
28. Shuttle. Help is on hand to keep your home warm this winter [Internet]. 2019. Available from: https://theshuttle.org.uk/help-is-on-hand-to-keep-your-home-warm-this-winter/
29. PHE. Public health outcomes framework [Internet]. Public Health England; 2018. Available from: https://fingertips.phe.org.uk/profile/public-health-outcomes-framework
30. CEDAR. FEAT (food environment assessment tool) [Internet]. University of Cambridge; 2017. Available from: www.feat-tool.org.uk
31. Guardian. ‘Chips and a burger for a quid’ – welcome to the takeaway capital of england [Internet]. 2017. Available from: https://www.theguardian.com/inequality/the-northerner/2017/jul/28/chips-burger-for-quid-welcome-to-takeaway-capital-of-england-blackburn
32. Guardian. Children in poor areas exposed to five times as many fast food takeaways [Internet]. 2017. Available from: https://www.theguardian.com/inequality/2017/dec/01/schoolchildren-poor-areas-exposed-fast-food-takeaways
33. PHE. Fast food outlets: Density by local authority in england [Internet]. Public Health England; 2018. Available from: https://www.gov.uk/government/publications/fast-food-outlets-density-by-local-authority-in-england
34. CEDAR. Takeaways and child obesity (evidence to house of commons child obesity inquiry) [Internet]. University of Cambridge; 2018. Available from: http://www.cedar.iph.cam.ac.uk/wp-content/uploads/2018/04/Health_Committee_Childhood_Obesity_April18_Takeaways_child_obesity.pdf
35. BwDBC. Eat well, move more, shape up – blackburn with darwen’s food, physical activity and healthy weight strategy 2017-2020 [Internet]. Blackburn with Darwen Borough Council; 2017. Available from: https://www.blackburn.gov.uk/Public%20health%20docs/Eat-Well-Move-More-Shape-Up.pdf
36. BwDBC. Planning for health – supplementary planning document [Internet]. Blackburn with Darwen Borough Council; 2016. Available from: http://www.blackburn.gov.uk/planningdocs/SPD/Planning%20for%20Health%20SPD%20-%20ADOPTED.pdf
37. Social Mobility Commission. Social mobility in great britain: Fifth state of the nation report [Internet]. 2017. Available from: https://www.gov.uk/government/publications/state-of-the-nation-2017, with data at https://www.gov.uk/government/publications/social-mobility-index-2017-data
38. What Works Wellbeing. Find your area’s wellbeing scores – new data release [Internet]. 2017. Available from: https://www.whatworkswellbeing.org/blog/find-your-areas-wellbeing-scores-new-data-release/
‘Full Service’ means that Universal Credit is available to all types of new claimants, rather than being restricted (as before) to those whose claims are relatively simple.↩
All recorded crime figures have to be treated with caution, as they do not currently meet the standards required for National Statistics status.↩
Public Health England is quite candid about the fact that the definition of a ‘fast food outlet’ is somewhat arbitrary.↩